
Currency conversion in Looker Studio reports
In this post, we will take a look at how you can make a currency conversion in Looker Studio reports based on real historical currency rates. In this solution, we will use Google Sheets that will populate real currency rates based on Google Finance data that you can blend with any other data source to calculate accurate rates for your main or alternative currencies.
Overview of the original dataset
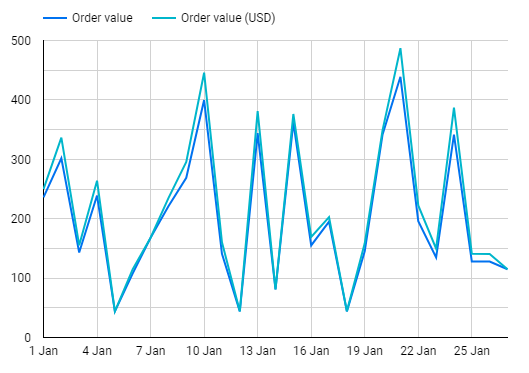
For the sake of example, I will use sales export where we have multiple currencies, and the reported order value could be either in USD or EUR. Our task is to unify those values and convert them into a single currency dynamically.
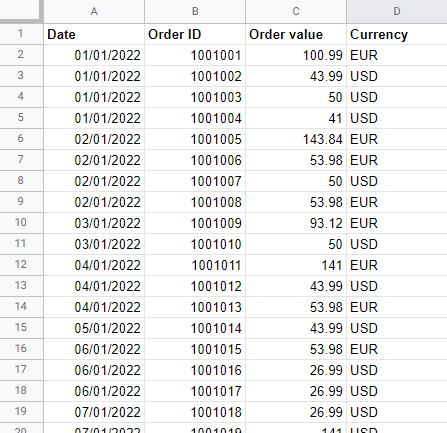
I will convert all my Order values into USD, so whenever my order is in EUR I need to multiply the order value by the actual currency rate for that day. For example, if we assume that the currency rate for EUR to USD on 01/01/2022 was 1.14, then for the 1st of January I would expect to see:
100.99 * 1.14 + 43.99 + 50 + 41 = 250.12 USD
Connect the original dataset to Looker Studio
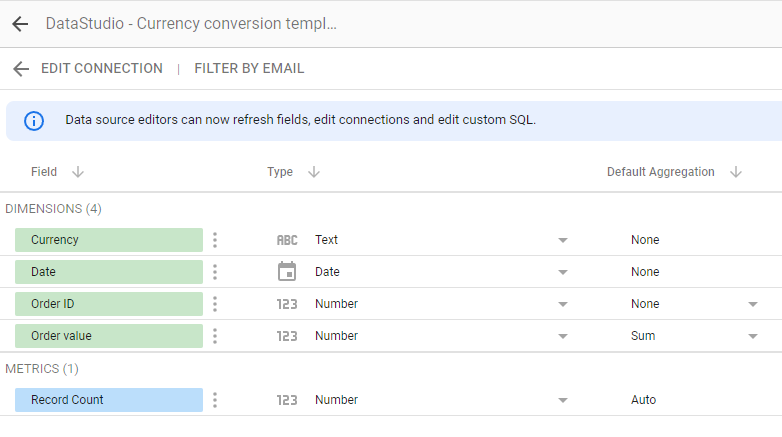
Doesn’t matter where your data is located – in a Google spreadsheet, SQL database, or Ads platform (e.g. Google Ads), you need to connect it to Data Studio and make sure that it includes 2 mandatory dimensions necessary for currency conversion – Date and currency.
You need a currency dimension if your report has multiple currencies. If all your values are using the same currency that you want to convert, you can skip it.
In my example, after connecting Google Sheets, the data source will look like this:
Create automatic Google Sheets feed with exchange rates
Next, we will use Google Sheets to create a reference with historical currency exchange rates that we will use later and blend it in Data Studio.
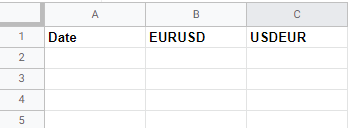
Create a new Google Spreadsheet or a new tab in the same file and add here 2 columns – Date and Exchange rate. If you have more than 1 currency that you want to convert you could have additional columns per currency.
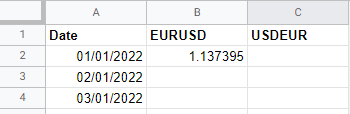
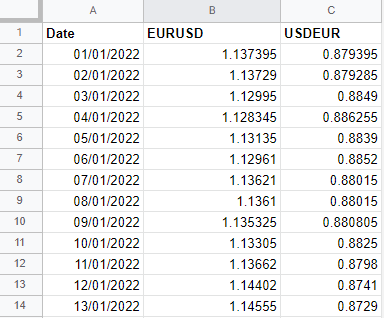
In my example, I will have 3 columns – Date, EURUSD, USDEUR . Depending on what additional conversions you want to perform you could have CADUSD, CNYUSD, etc.
As we will blend this data with our orders data set, we need to have currency rates available at least for the same date range as our orders. In my case, it was starting from 01/01/2022.
To display the real exchange rate (Based on Google Finance data) we will use the following function:
=GOOGLEFINANCE()As per official documentation, GOOGLEFINANCE() accepts multiple parameters, and to get the exchange rate for a provided date we can use:
GOOGLEFINANCE("CURRENCY:EURUSD","price", A2)- You should replace EURUSD with your own cyrrency pair for each column
- You should replace A2 with the cell that contains the date
The output of this function will look like this:
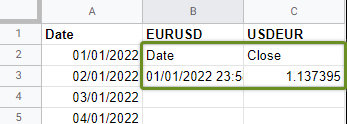
As you can see the result has multiple rows and columns, but all we need is the value from the bottom right cell “1.137395”. We can use INDEX() function to clean this up and output only the exchange rate, so the final formula will be following:
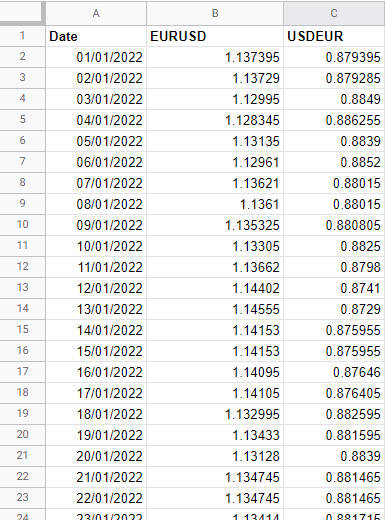
=INDEX(GOOGLEFINANCE("CURRENCY:EURUSD","price", A2),2,2)And you should see a similar result in your spreadsheet:
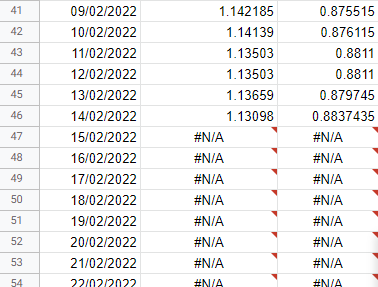
Now, all we have to do is to add any missing currency exchange rates and expand this formula for a longer date range.
If your order data is updated daily then you might want to have exchange rates added to this sheet in the future as well. To do that, just use the date in the future for the formula and it will update automatically once Google Finance data is available.
Once everything is ready, connect this sheet to Data Studio.
Blending currency rates with your data
When we have both datasets in Looker Studio we want to join them by date, so that we can accurately convert currency.
Go to Resource > Manage blends , and create a new blended source
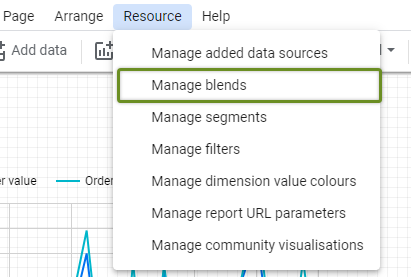
As the first source – select your original data set, whether it’s sales, ad costs, or anything else. And for the second source select the Currency exchange rate sheet.
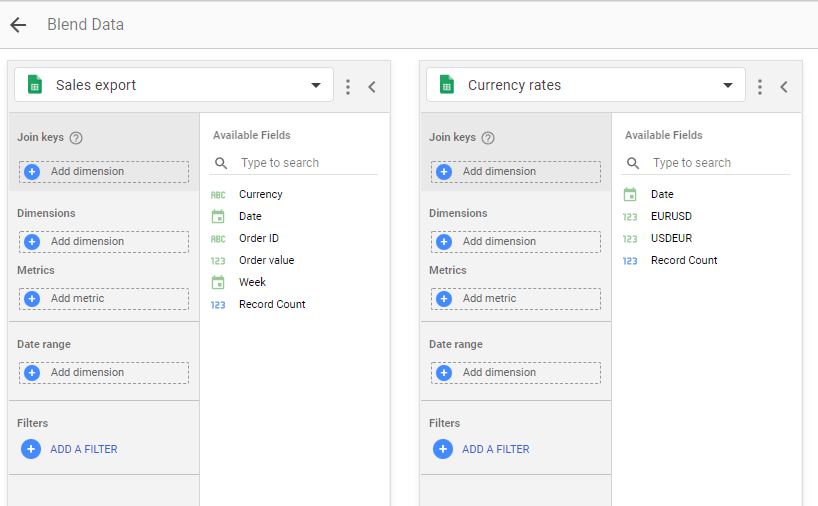
Select Date dimension as the Join keys for both sources. Then add all relevant Metrics and dimensions to each source and don’t forget to add the Date dimension for the “Date range” section. The complete setup should look similar to this:
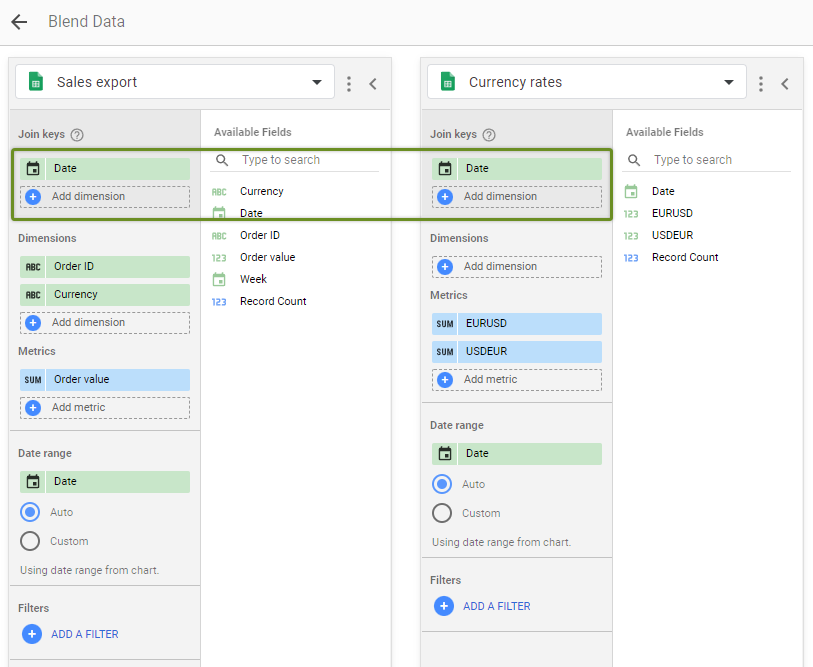
Save blended data set and we are now ready to convert some currencies 🙂
Converting currency in charts
As you might have guessed – our adjusted and converted currency will be a calculated field. Unfortunately, you can’t create calculated fields directly inside blended data sources yet, so for each chart, you will have to copy the formula to display accurate values.
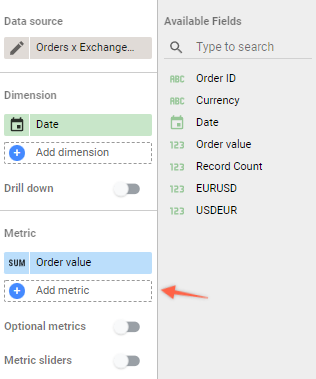
To start, create a new chart or table based on a blended data source that we have just created. Just a simple table will do.
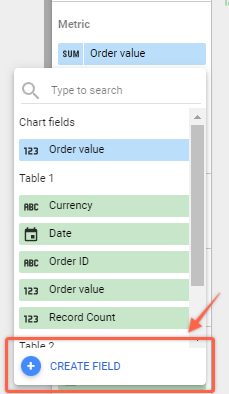
Add a new metric and click “Create field”
Now we want to convert any EUR values to USD. To check the currency in which our order was placed we will use the “Currency” field. To filter out EUR values we will use a CASE statement.
The final formula will look like this:
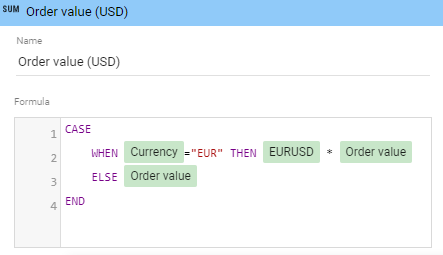
CASE
    WHEN Currency="EUR" THEN EURUSD * Order value
    ELSE Order value
END
So what is happening here?
- We have a CASE statement that checks when “Currency” field equals “EUR”
- If currency is NOT EUR, we return original “Order value” field, assuming that there is no other currency in the export.
- When currency matches EUR – we multiply exchange rate with “Order value”
If you would have more than 2 currencies in total you would create additional WHEN conditions for each one of them.
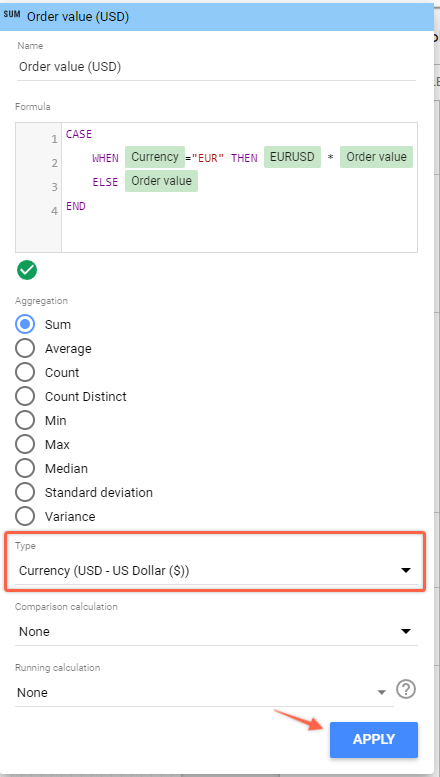
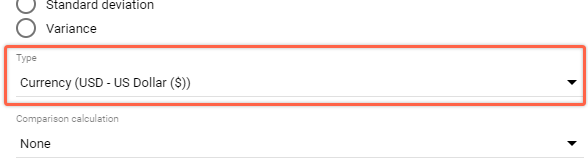
Now you can pick a field Type to format it using your main currency and click “Apply”.
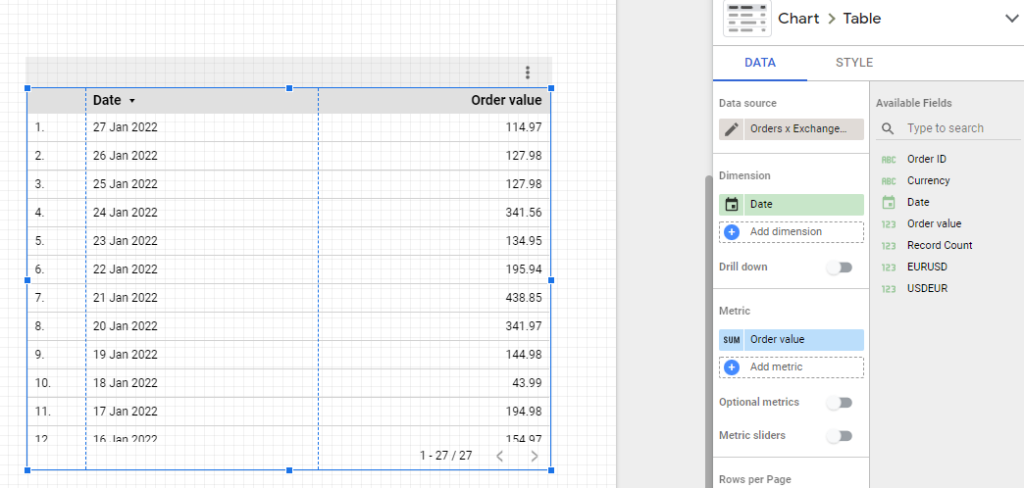
Now you should see similar results in your table:
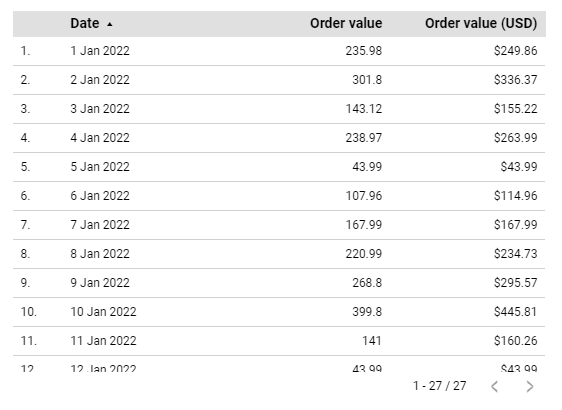
Notice how for some of the dates we have the same Order value in USD as in the original data set (5th and 7th of January). This is what we would expect since those dates contained only USD order values.
And that’s it! You can then copy the formula and use the same custom field in any chart.
Make it more advanced – change active currency dynamically
In some cases, you might want to use a different main currency to display your reports (E.g. for different teams in the US or Europe). While you could just copy this dashboard and adjust custom formulas for another currency, sometimes it might be tempting to show off your Looker Studio skills.
So, if you want to create currency conversion in Looker Studio dynamically – here are the steps!
Note that the steps below are specifically tailored to cases when you have only 2 currencies. For 3+ currencies you would need to adjust formulas.
Step 1 – Make sure you have available data in the Currency exchange rate table.
In my example, I will allow picking only EUR or USD, so it will be enough to have conversion rates for EUR to USD and USD to EUR. If you have more currencies you will need to have 2 columns per pair.
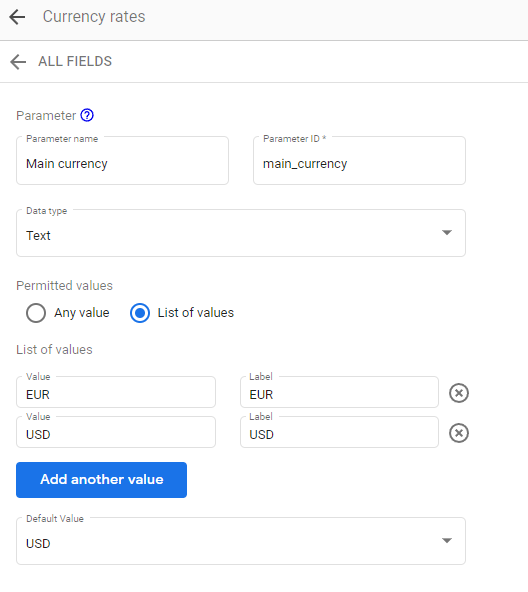
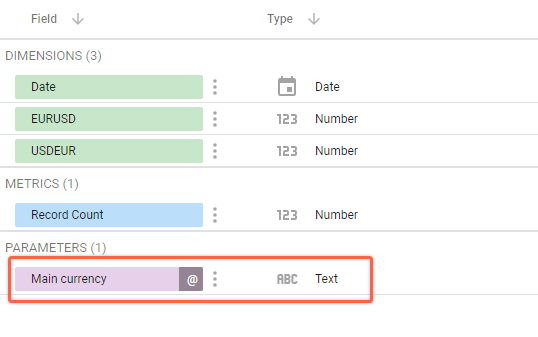
Step 2 – Create custom parameter in “Currency rates” source
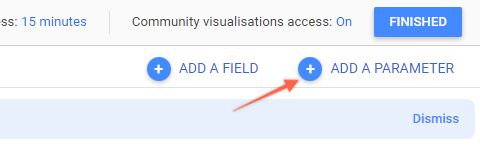
We will use this to pass the currency that we want to display. Name it “Main currency”, select type “Text” and you can provide a list of possible values and pre-selected option (USD in my case).
You should see this purple label under the “Parameters” section.
Step 3 – Create additional custom fields
Now we need to create 2 more additional fields here – Dynamic currency rate and Opposite of selected currency.
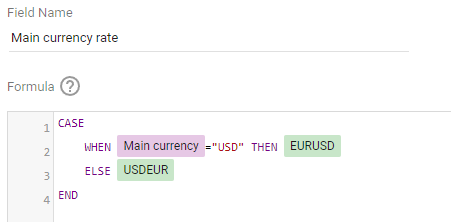
CASE
    WHEN Main currency="USD" THEN EURUSD
    ELSE USDEUR
END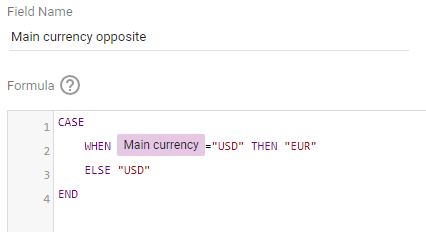
CASE
    WHEN Main currency="USD" THEN "EUR"
    ELSE "USD"
END
What are we doing here?
- Based on selected “Main currency” parameter we return which exchange rate to use
- Based on selected “Main currency” we return opposite currency that will be matched for calculation (see below)
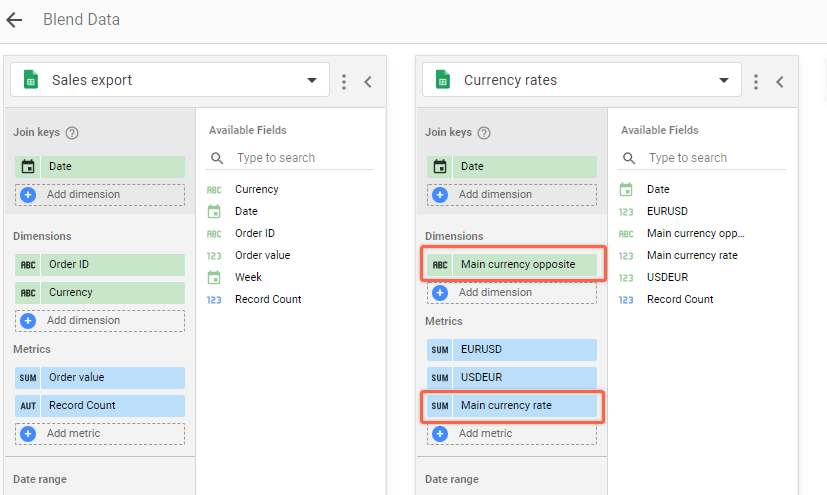
Step 4 – Include new custom fields in blended data source
Edit the blended data source that we created above and make sure new fields are included.
Step 5 – Adjust formulas
Now, the formula needs to be adjusted so that we multiply order value by the correct currency exchange rate each time that’s changed.
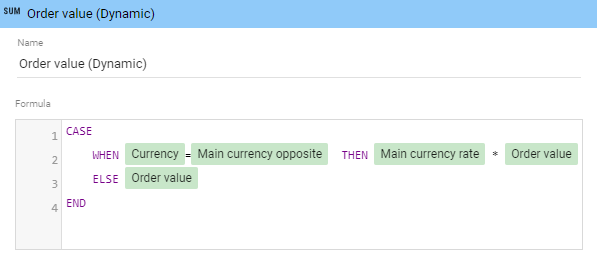
CASE
    WHEN Currency=Main currency opposite THEN Main currency rate * Order value
    ELSE Order value
END
So in this example when the Currency of order matches the opposite of the main currency – we convert order value. This example will work only with 2 currencies, you will need to customize this if more values are used.
Unfortunately, we can’t provide our metric type dynamically here, so we need to pick something neutral – Number.
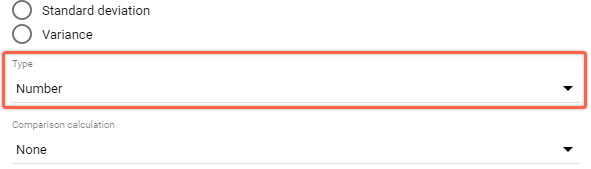
Click “Apply”.
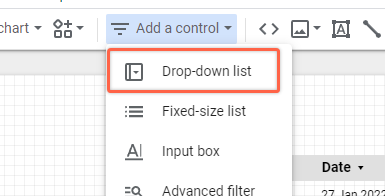
Step 6 – Add a filter to select the main currency
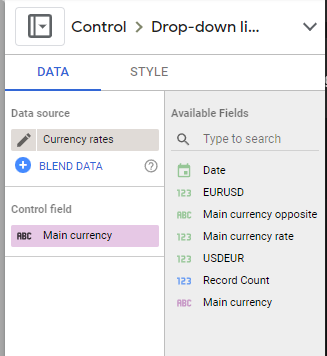
Click “Add control” and select Drop-down list.
Select “Currency rates” as a data source and pick the purple “Main currency” parameter.
And we should be good to go! You can play around with the filter and see how it is converted to different currency on the fly.
Pre-select dynamic currency in report URL
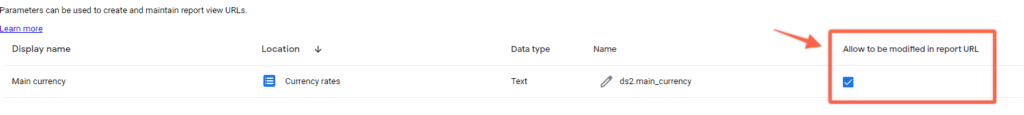
It is also possible to embed parameter values already in the link, so that necessary currency is already pre-selected for the viewer.
To enable this, go to – Resource > Manager report URL parameters and make sure the “Allow to be modified in report URL” checkbox is enabled.
Then you would use the name (in my case “ds2.main_currency”) to make a parameter JSON object that we can include in the URL using ?params= parameter.
{
  "ds2.main_currency": "EUR"
}
So the actual URL that you could use to pre-set the main currency to EUR would be:
https://datastudio.google.com/u/0/reporting/aaaaaaaa-aaaa-1111-1111-7638e430bfc5/page/AymlC?params={"ds2.main_currency":"EUR"}?params={“ds2.main_currency”:”EUR”} part is what you would append to your reports.
Summary
You can find a template that was used here to kick off your dashboard faster – Sheets file, Looker Studio report.
Although the example shows data blending from Google Sheets you could also use a different data source (E.g. Google Ads) and actual currency rates to display more accurate costs or revenues.
I hope you found it useful, and let me know if there are any comments or questions!
