
Looker Studio filter control using charts
Recently I learned that we can actually use charts as dynamic filter controls in Data Studio and we can even filter data using a selected range from your time series, which came as a pleasant surprise. Let’s take a look at a few examples of what is possible and how you can add this to your reports.
Google calls it a “Chart cross-filtering” and it is available in the “Data” tab when your chart is selected.
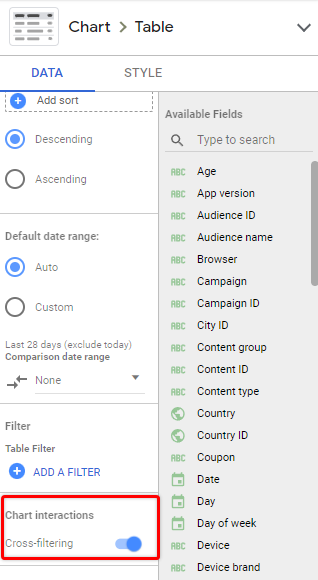
When the checkbox is selected Data Studio will allow to click on dimensions displayed in your charts and it will filter all data from the same data source.
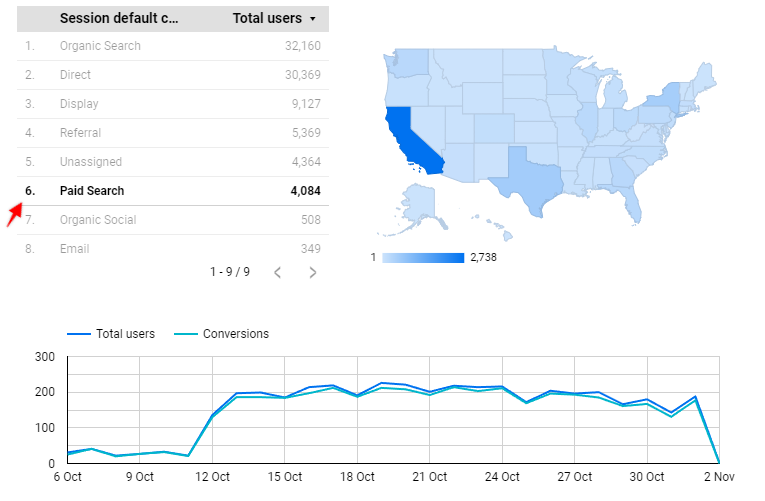
The same way it works on maps, treemaps, pie charts, and even on time series!
To use it on time series and filter specific time period, just click on a chart and select a date range that you want to investigate.
Also, you can:
- Apply chart filter controls only within specific group (same as standard filters)
- Select multiple values for segmentation using Ctrl + click (Cmd + click on Mac)
- To reset filters just click anywhere outside chart
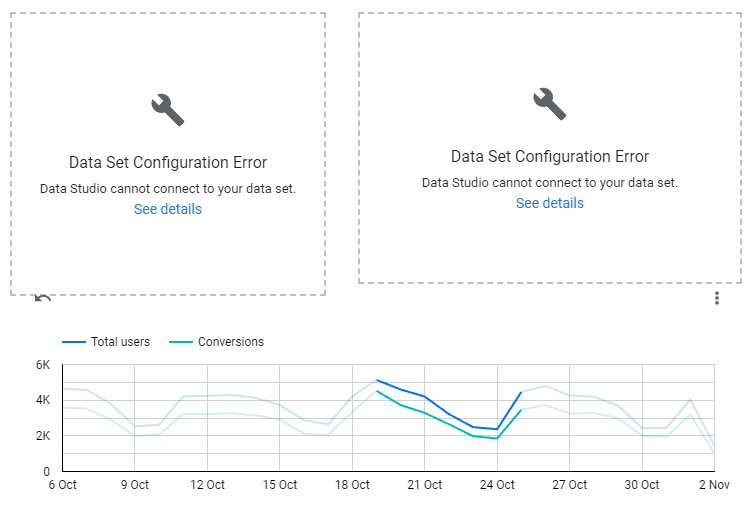
Note that as always, still some bugs are possible and this will not work for all data sources and scenarios. In my example, it worked for Google Analytics 3 data, but I had issues with GA4 data source, where time-series filtering threw an error on other charts:
This feature also has some known limitations that you should be aware of:
- You cannot filter data across multiple data sources (same as using standard Data Studio filter controls)
- You can’t filter data that is grouped under “Other” category (for example in pie charts)
When it is useful?
I think the main benefit of this feature is to make interaction with your data more seamless and intuitive. Once you and consumers of your reports know that it is possible to filter data by clicking values in the chart, you will never look at your dashboard the same again!
At least in my dashboards, it will save some space and replace a few dropdown-based filter controls that I used previously (Ugh!).
Hope you will find it useful, and here is an example that you can click and test on your own
