
Google Analytics 4 funnel report – hands-on tutorial
So you already have Google Analytics 4 added on your website, but haven’t figured out yet how you can extract some real value out of all those fancy features without spending too much time on diving deep into the topic.
Here I will share with you one of the first Google Analytics funnel reports that I like to set up for a new implementation of GA4 to immediately extract some valuable bits of information.
We are going to build an E-commerce funnel report to investigate drop off rates from different stages of the funnel and I will show you how to easily slice the report to view any step conversion rates by browser, country, device category etc.
Here is the end result of what we are going to built in our Google Analytics funnel report:
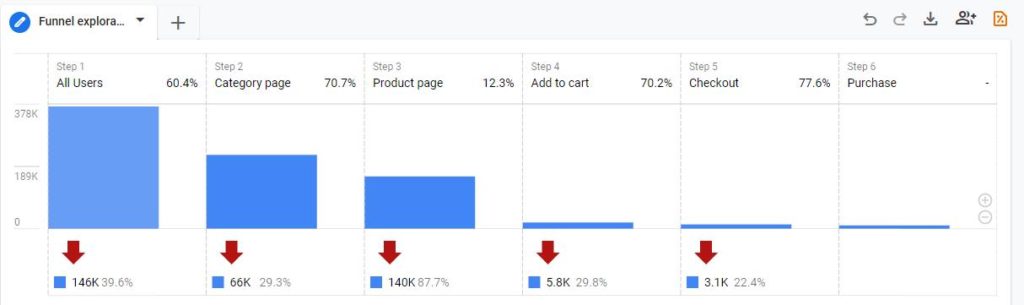
The steps that I will create in my example will be:
- All visitors
- Category page visitors
- Product details page visitors
- Visitors who Added product to cart
- Checkout visitors
- Completed purchase
You can easily adapt those steps that better fit your website structure, and it does not necessarily have to be an E-commerce store. The steps described below can be applied to any website where you have multiple stages that user needs to go through before finishing any of the website goals (subscription, sign up, purchase, referral click, etc…).
So, let’s dive in!
1) Create a new funnel report
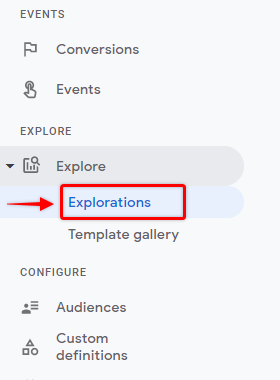
In your Google Analytics property navigate to the left menu and click on “Explore” > “Explorations”
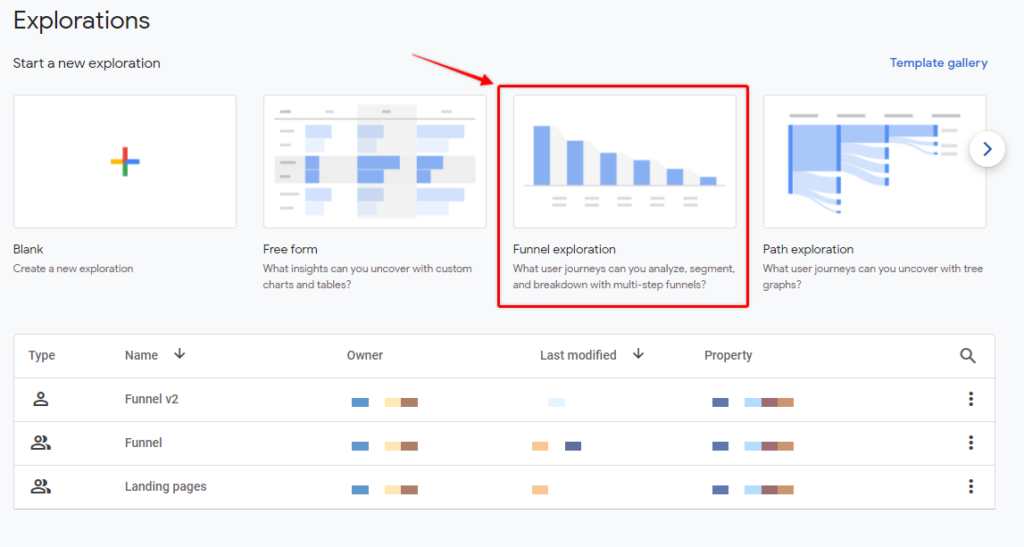
You will see a screen with your most recent reports created in GA4 and some of the templates on the top.
Click on “Funnel exploration” to create a new Funnel report.
You should see a similar view as I have in the screenshot below. Google will show a template with some pre-set settings that we are going to change in the next step.
2) Adjust funnel steps
When we have a blank template in place, let’s start with adjusting the funnel step settings so that it represents user flow on our website.
Under the “Tab settings” section find a block named “Steps” and click on a pencil icon to edit.
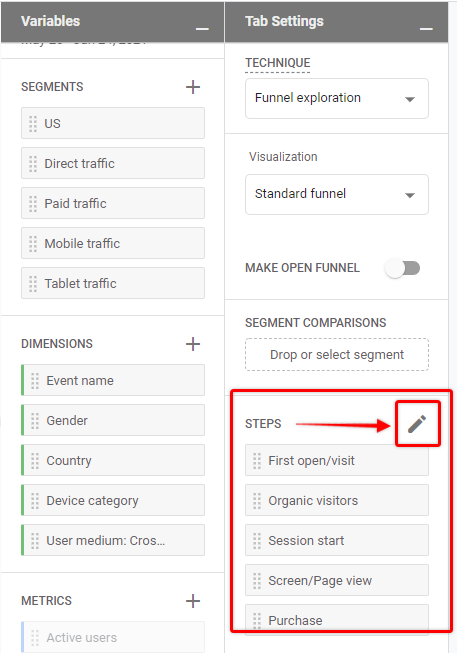
In the funnel step popover let’s delete all the predefined steps, since we are not going to use them.
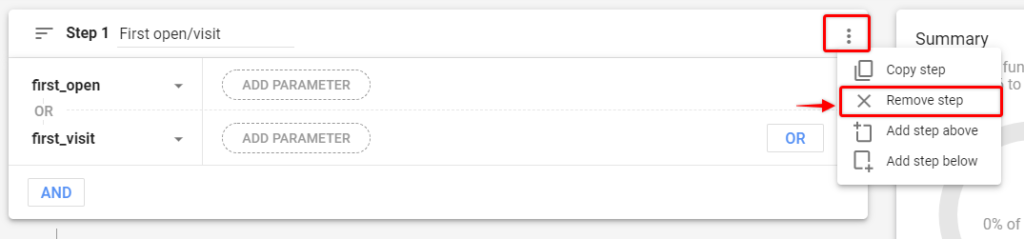
Find the three dots icon on the right side of the individual step container and select “Remove step”.
Repeat this for all the steps you see in the settings.
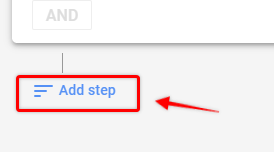
Now, from the clean slate add funnel step placeholders. In my case I want to display 6 funnel steps, so I will add 5 more steps by clicking on the “Add step” button at the bottom of the settings menu.
Depending on the funnel step count that you want to see in the report, this value will be different for you, although keep in mind that the maximum number of steps that you can create in GA4 funnel report will be 10.
When you have all the step placeholders, let’s start adjusting the settings.
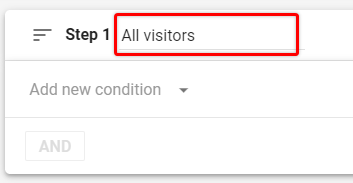
- Step 1 – All visitors
This step should display all visitors of the website so that I can see the overall conversion rate and conversion rate to the next best action.
For this let’s adjust 2 things. First, let’s rename our segment to All visitors.
And then from “Add new condition” dropdown select “Events” > “session_start”
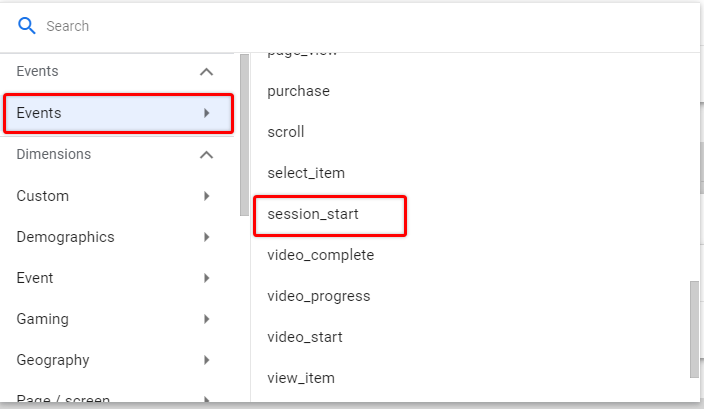
We are using the “session_start” event because almost all visitors in a given date range would have this event. Exception would be if someone starts their visit before our selected time interval and has some interaction with the website after midnight that falls under the selected time period, but that is a very small percentage of users.
- Step 2 – Category page visitors
The next interaction in my list is Product category page visitors. The easiest way you can target those users is by using a URL pattern from your website.
For example, some of my product category page URLs are:
example.com/categories/category_name_1
example.com/categories/another_category_name_2
example.com/categories/category_name_3
Each page URL from category contains /categories/ so I will use that in the step settings.
Please adjust that as per your website and funnel structure, because that will be unique almost for any website.
Under step 2, again change name to “Category page” or your custom next step name.
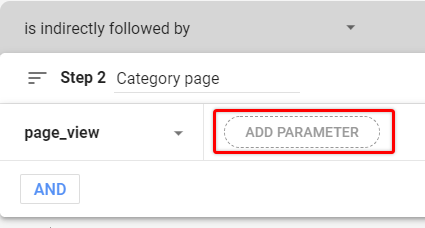
Then, from “Add new condition” dropdown select “Events” > “page_view”.
This will target all people who had a Page view on your website, so we need to filter this further and add conditions to display a specific page.
Click on the “Add parameter” button.
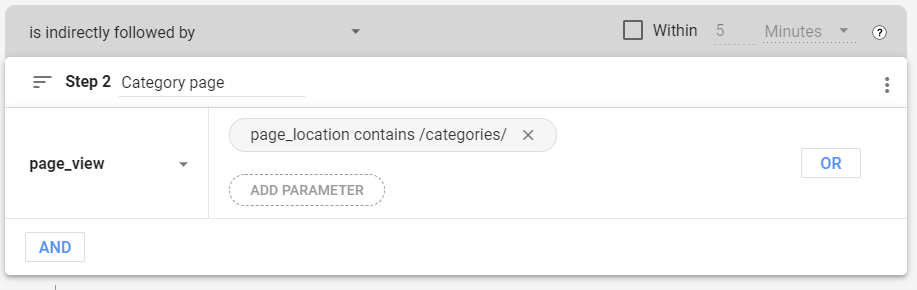
From the dropdown search for page_location , then select condition “Contains” and paste the page URL pattern that is used for Category pages.
In my case, it is “/categories/”, so the final result for Step 2 should look similar to the screenshot below.
Note!
There might be cases where you don’t have a URL pattern that you can use for a specific page type. In those scenarios, you need to have a unique custom event that represents certain page visits or a custom event parameter with the page type. (in the future can add a separate article on adding custom events in GA4).
- Step 3 – Product details page visitors
In the next step we want to see product detail page visitors, so we will adjust settings similarly as for Step 2.
Change step 3 name and then from “Add new condition” dropdown select “Events” > “page_view”.
Then click on “Add parameter” and then from dropdown select page_location.
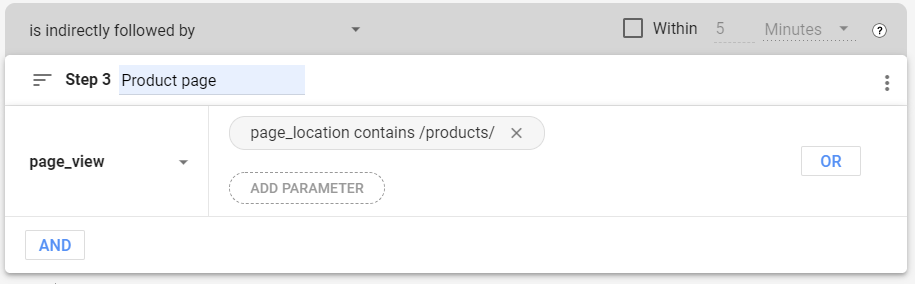
Set condition to “Contains” and paste page URL pattern that is used for Product pages, similarly as we did for the Category pages.
In my case it will be “/products/” and the final settings will look like this:
You have probably noticed that for step 2 and step 3 we have some additional settings that we can change if we want a bit more control on what data is reported.
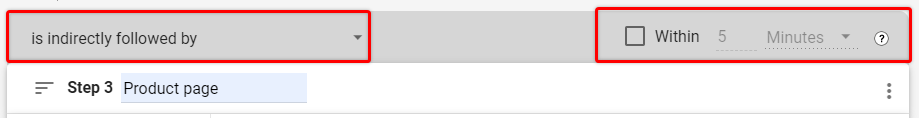
First of all, we can control how strict we want to be with our funnel step conditions. By default, we will include any Product page visits regardless if the Category page was seen right before that or not.
To change that and display only visitors who have seen the Category page and right after that followed to the Product page – you can select “Is directly followed by” from the first dropdown.
Secondly, we are also able to set a time constraint for our steps. For example, if you want to include users who have seen a product page within 10 minutes after seeing the Category page, you can tick the “Within” checkbox and pick the right interval.
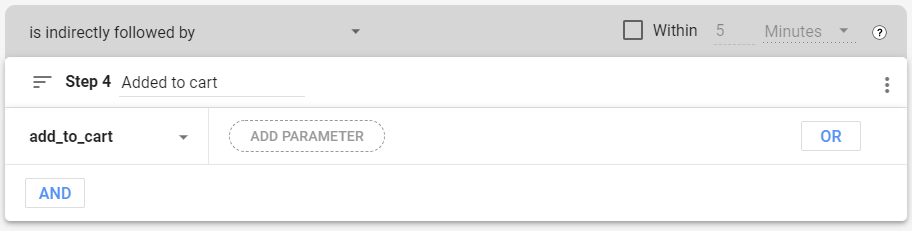
- Step 4 – Visitors who Added product to cart
If you want to include a similar step in your funnel then you need to have a separate event to track when a product is added to the cart.
Please see official GA4 documentation on how to do that for gtag or using Google Tag Manager
To display all the visitors who have added products to the cart we will use an event with the same name. For this step, change the name and then from the “Add new condition” dropdown select “Events” > “add_to_cart”.
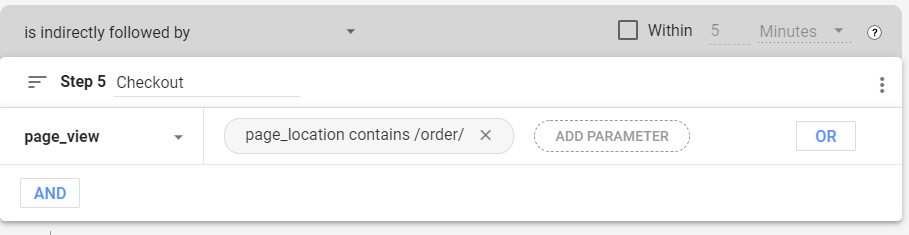
- Step 5 – Checkout page visitors
Now, in my case, I have checkout as the next step. Here, depending on how well your website is tagged for the GA4 e-commerce events you could use either a Page view event for a specific URL or a separate event named “begin_checkout”.
I will use an URL pattern same as for Steps 2 & 3.
Again, I will select “page_view” as my step event and from parameter dropdown select page_location.
My checkout page URL contains “/order/” so I will add it there and click Apply.
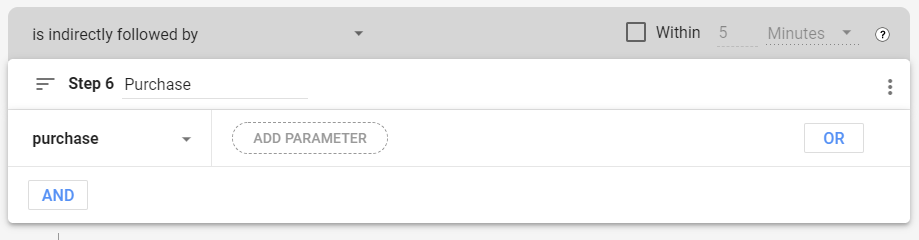
- Step 6 – Completed purchase
Final step on my ecommerce website is a purchase, so I will add it here.
Similarly, as in Step 4, we will use an ecommerce “purchase” event in this example, but you would be fine to use a thank you page URL as well similarly as in steps 2 & 3.
From the “Add new condition” dropdown select “Events” > “purchase”.
Congratulations! Now you have basic funnel settings in place.
Let’s save our progress by clicking “Apply” in the top right corner and take a look at what we have created so far.
3) Start using the report
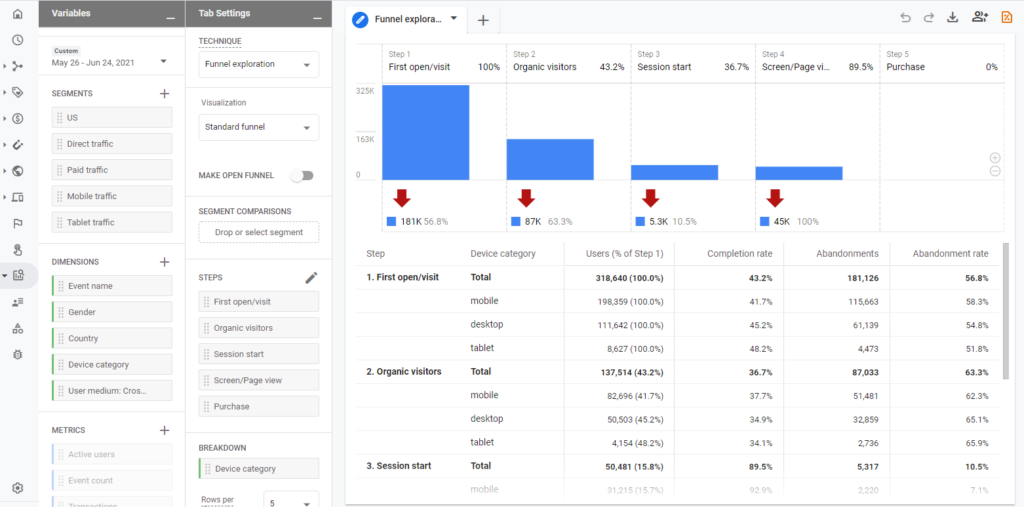
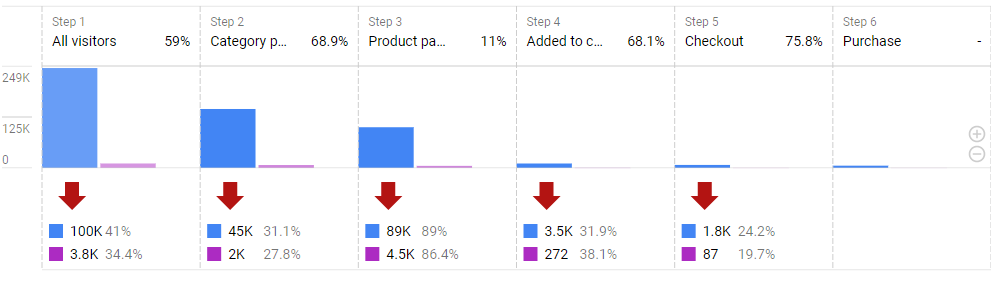
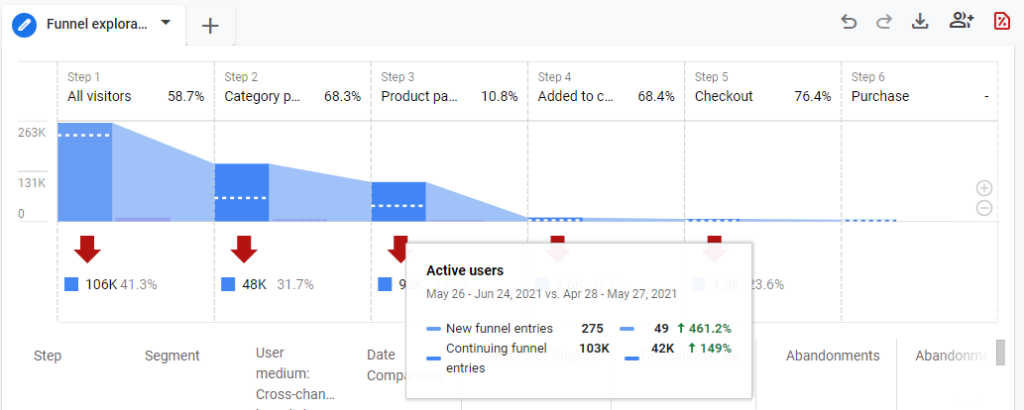
After you have applied the settings you should be able to see something very similar to what I have here:
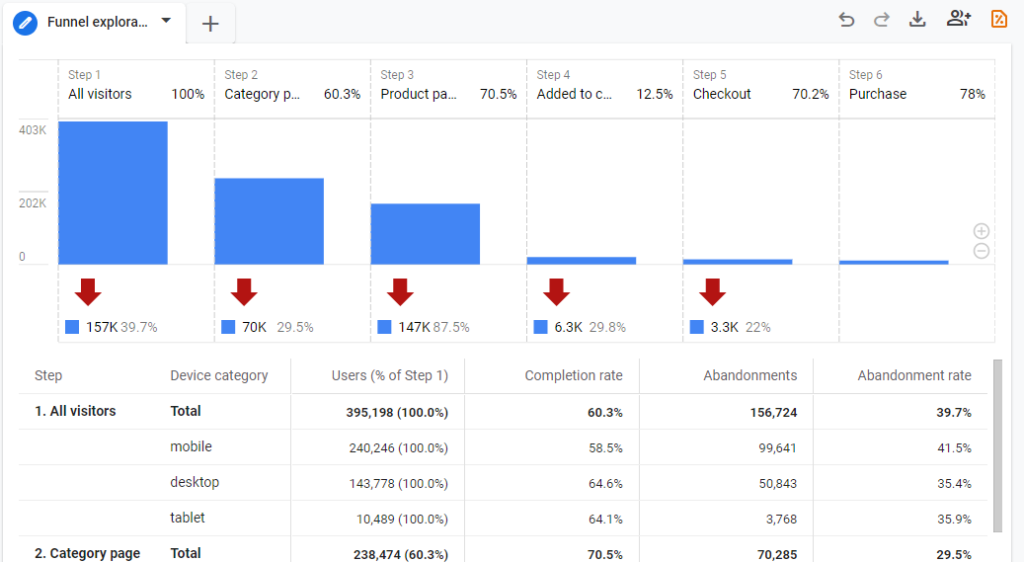
You will see all the added steps displayed in a column chart where for each step you will see a conversion rate (E.g. 60.3% from All visitors to Category page) and a drop-off rate under the red arrow (e.g. 39.7% did not see a Category page).
Under the column chart you will have a table where we can explore conversion rates and abandonments per each step and breakdown dimension in more detail.
- “Users (% of Step 1)” – Will show the absolute number of users and their share compared to the first funnel steps for each step. Useful to get an idea of what is the total conversion rate up to a certain funnel step or for the main funnel goal overall.
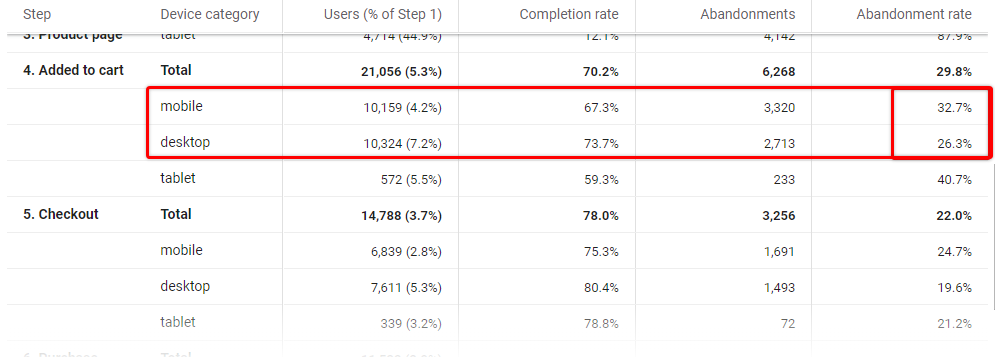
- “Completion rate” will show the share of users who proceeded to the next funnel step. Will be useful to evaluate if there are problems with particular funnel steps or even breakdown segments within specific steps.
- “Abandonments” will show the total number of users who didn’t reach the next step of the funnel.
- “Abandonment rate” will display a share of users that have abandoned a particular funnel step.
A particularly useful feature here is the ability to add a breakdown dimension to compare how a specific funnel step performs for different device categories, countries, channels, and other factors.
In the default template, we already have a “Device category” breakdown dimension added and it allows us to see, for example, that we have a 23% higher abandonment rate from mobile than from desktop for users who have added product to the cart.
To change the breakdown dimension go to “Tab settings” > “Breakdown” and then move one of the dimensions from the “Variables / Dimensions” section into the slot.
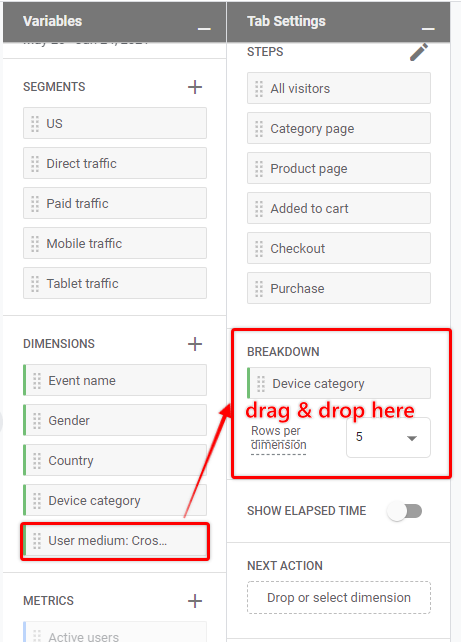
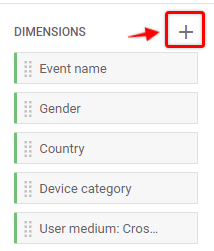
To add additional dimensions, just click on the “+” icon near the dimension list and then drop them to the Breakdown list.
If we drag & drop User medium dimension, then your report now should look similar to this, split per top 5 mediums for each funnel step:
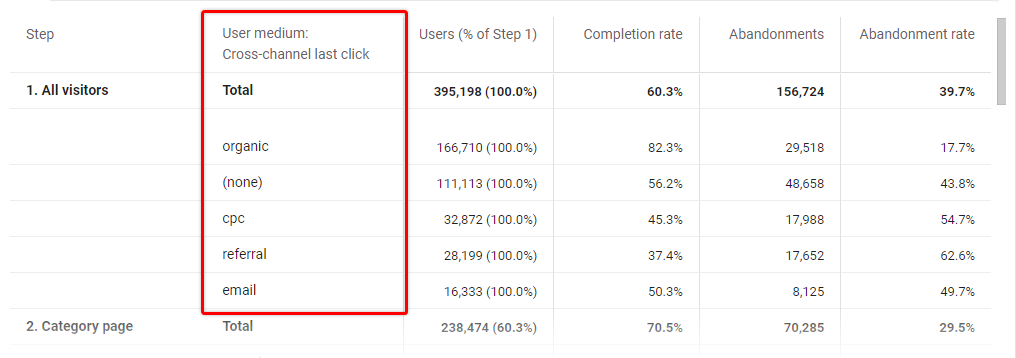
This would already allow you to uncover interesting insights and patterns about your purchase funnel and user behavior from different angles.
To finalize this example, let’s take a look at additional features that we can utilize.
4) Customize and finetune
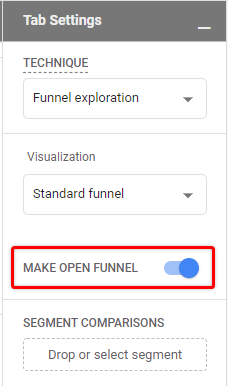
- Open or close funnel
By default we have a closed funnel, which means that you need to complete the previous step before you would be eligible to be counted in the next one.
We can change this and allow users to enter the funnel for example from Product page views by simply clicking “Make open funnel” in the “Tab Settings”.
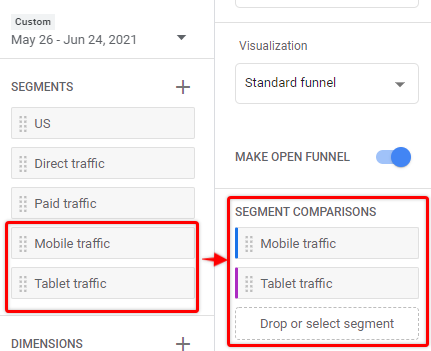
- Compare different segments
It’s also possible to compare different segments under the same funnel view, similarly as in other GA reports.
To add a new segment simply drag them from the “Segments section” or create a new one by clicking “+” icon near the Segments section.
When multiple segments are applied at the same time, you column chart will also change and display them separately as in the screenshot below:
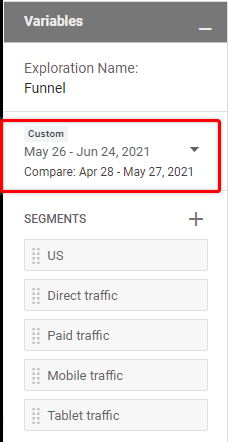
- Play with the date range
In case you haven’t found it yet, in Exploration reports date range can be changed on the top of “Variables” block.
It’s also possible to select comparison time intervals and the data for the previous period will appear in your chart as well:
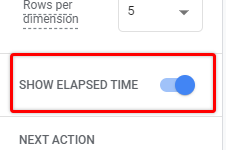
- Add average elapsed time between the steps
Ever wondered how much time it takes on average for a user to complete checkout?
Enable “Show elapsed time” checkbox in “Tab settings” and find out!
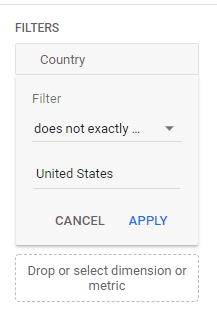
- Use filters to include or exclude certain types of users
To further improve your analysis use the “Filters” section in “Tab settings”. For example, you can filter out a specific country and the user from that geolocation will not appear in your funnel report.
Summary
In this tutorial, we have created a simple Google Analytics funnel report that can be used to analyze how well your traffic is converting on each stage of the purchase journey. For your convenience, you can also have multiple funnel reports prepared for your website to view specific user flow in more detail, for example, checkout steps or sign-up steps.
Depending on the website, it’s often also enough to have basic GA4 tracking in place to start analyzing data, and you can easily customize your report by using filters, segments, and custom breakdown dimensions to get even more insights.
I hope you found this tutorial helpful and let me know if you have any questions!
