
DebugView in Google Analytics 4 (GA4) – Introduction
When you implement a new event or collect additional data about your visitors you want to test it first to make sure everything works as planned. DebugView in Google Analytics 4 is a great tool for real-time troubleshooting and quality assurance of your tracking implementation. Compared to Universal Analytics it’s a noticeable improvement over the old approach of scrambling data from real-time reports.
In this post, we will take a look at how to enable DebugView in GA4, how to use it, and how to interpret displayed information.
Where to find DebugView in Google Analytics 4?
Open Google Analytics 4 property and from the left menu go to Configure > DebugView.
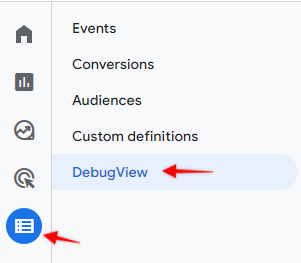
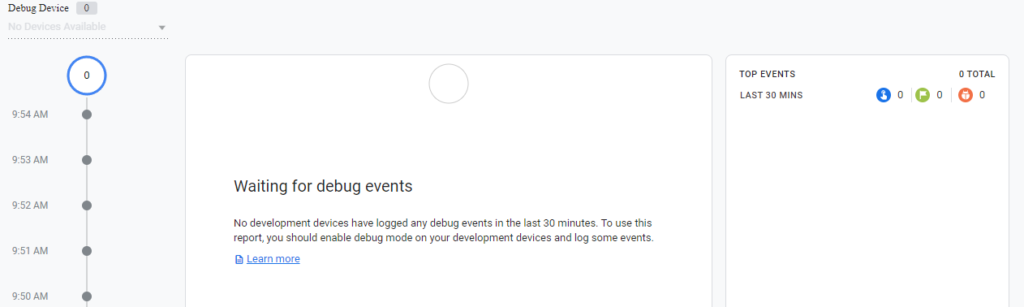
You won’t see any data here yet until any browser loads GA4 with enabled debug mode.
How to enable DebugView?
There are multiple ways how to display real-time data in this DebugView:
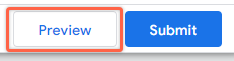
- Use Google Tag Manager Preview mode
When a preview is enabled, DebugView will be activated automatically and you will start seeing events in the timeline.
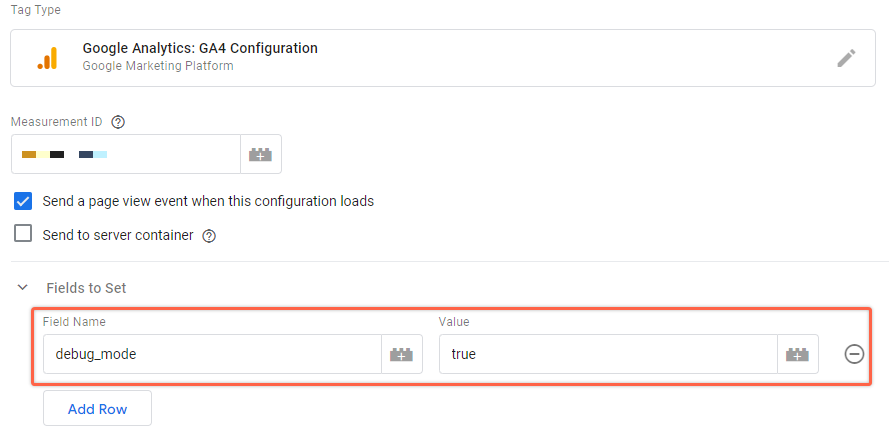
- Set debug_mode parameter to “true” in GA4 Configuration or Event tag.
If you set an additional parameter to GA4 tags you will be able to see details for all events that are being collected on the website. However, note that this will be active for all your customers (if published Live). It will not serve the purpose since you don’t know what exactly users are doing on the website.
When using Google Tag Manager, just use Preview mode to debug your events.
- Another option to enable debug mode using a Chrome plugin – Google Analytics Debugger
When you install the plugin just click on it to enable and reload the page. This plugin will attach debug attribute to your GA4 hits.
- If you are using Gtag for some reason to collect GA4 data you can enable debug mode by adding “debug_mode” parameter as shown below:
gtag('config', 'G-12345', {'debug_mode':true });The most convenient way how to make events flow into DebugView is to use GTM Preview mode. When Preview mode is loaded head back to the GA4 report and you should start seeing your interactions here.
If you don’t start seeing at least the “page_view” event here try to reload the DebugView tab in the browser (it usually helps me and events are loaded right away).
NB! Any collected data with a debug_mode enabled won’t be available in regular Google Analytics reports. Avoid publishing tags where this attribute is enabled for all visitors.
Event Timeline
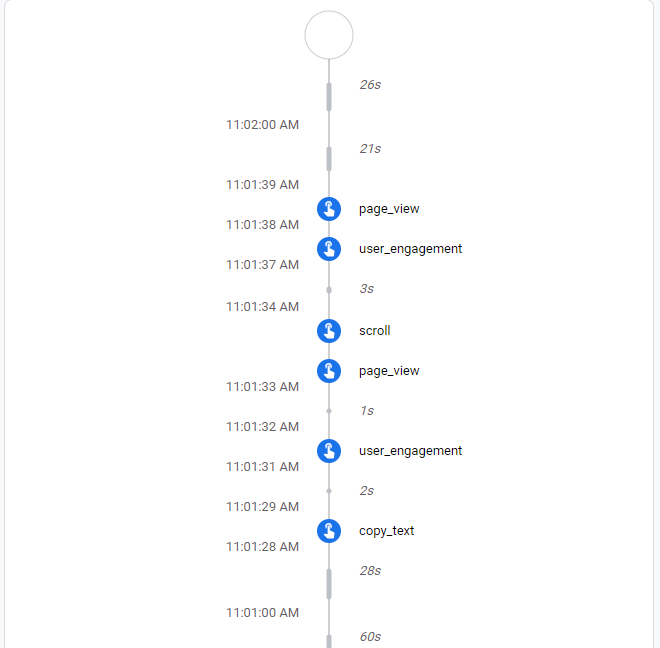
On the left side of DebugView you will always see event timeline split per minute un to the last available minute. Number of events that appeared in the current minute will be shown in the big circle above the timeline. Events that happened several minutes ago will appear in a smaller circle showing event count in given minute.
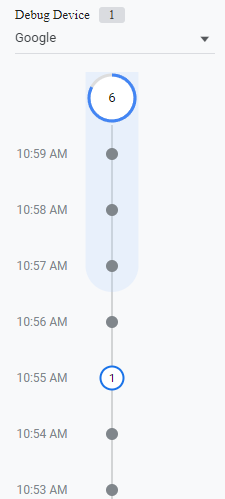
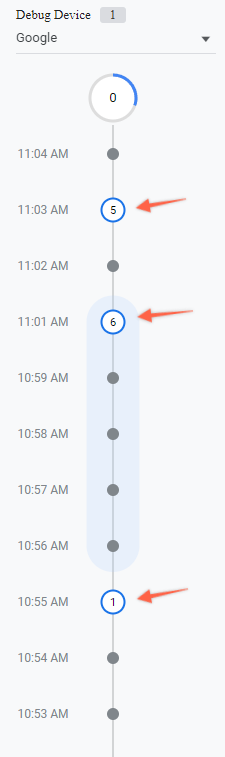
In this example we can see that 6 events have happened in the current minute and there was 1 event that occured on 10:55 AM. You can use this timeline as a navigation in Google Analytics DebugView to inspect collected data for selected time frame.
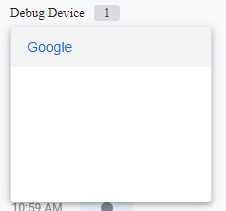
It is also possible to use multiple devices/browsers for debugging. For example you could enable preview mode from different machines and then switch between those devices under device list above event timeline.
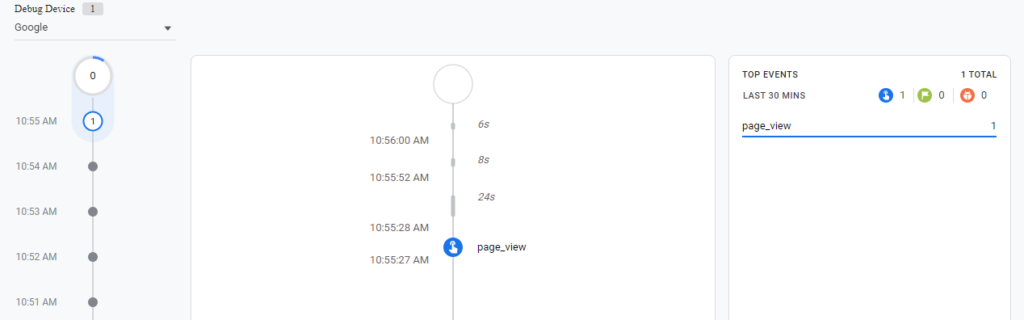
Event live feed
By default on the right side from event timeline you will see a more granular view of your events. DebugView will show live feed of all collected data in a chronologically ordered timeline.
You can click on each event to see more details about what attributes are being passed to Google Analytics. This is particularly useful to verify collected values if you are passing additional dimensions to GA4 (default or custom).
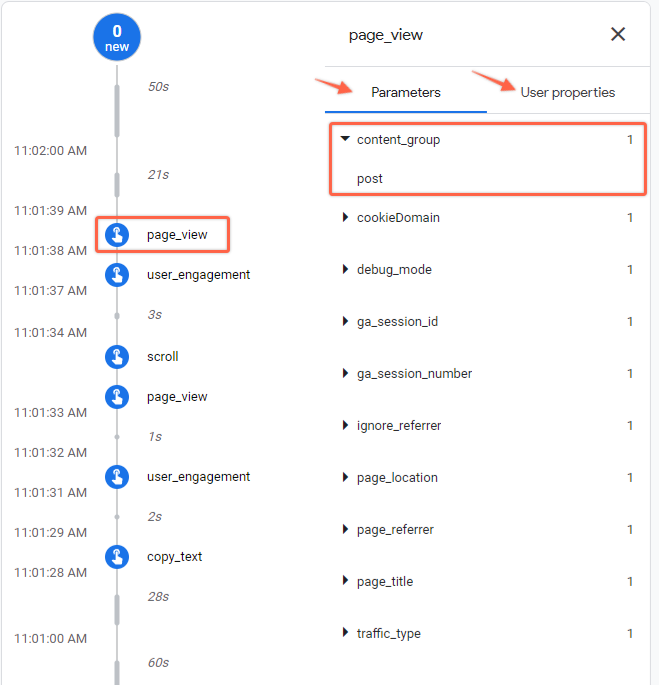
You can then click on each parameter or user property to see what value was received.
User properties in event feed
When a user property was set you will also see a special label in the event feed.
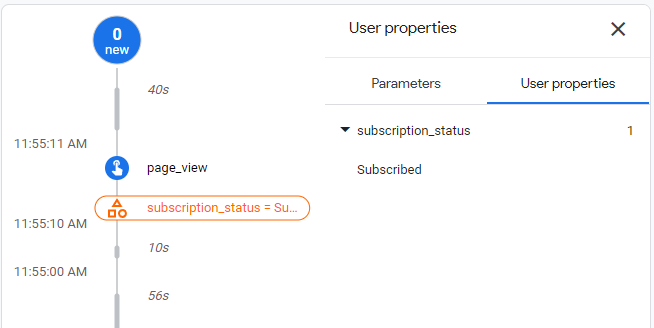
You can use this to identify if your user properties are being updated when expected more easily.
Conversion events in the event feed
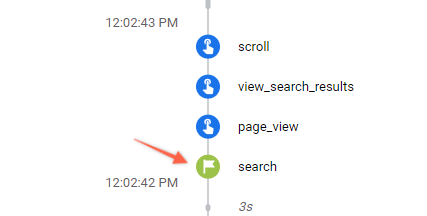
If your event was marked as a conversion in GA4 interace, then DebugView will use a different color to highlight it. This allows to notice valuable events more easier.
Pause and resume event feed
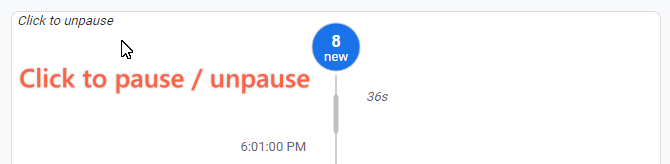
To focus only on a subset of events you can pause event feed by clicking on the top of the block (see screenshot). If will freeze the timeline and no new events will appear in the DebugView until you click again and unpause it.
Top Events summary
On the right side you can find a summary of all events collected in the last 30 minutes for selected Debug Device. Separately Google Analytics will also try to group conversion (green) and error (orange) event count on top.
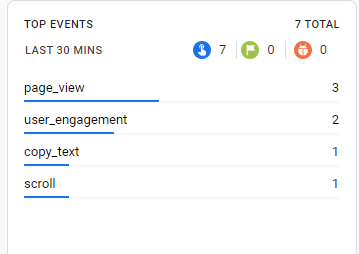
I tried to send an exception event that should be registered in the orange section, but it seems it’s not working as I expected (at least for web). Most likely will work for app related exceptions and app crashes. Let me know if this worked for you on the web!

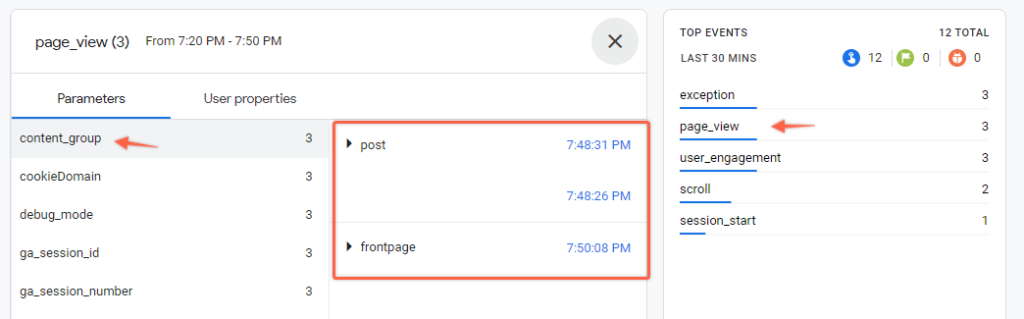
If you click on any event from the Top events section a detailed list of parameters will appear similarly as in the event feed. When you click on a parameter name you will see a full histrory of the values for that parameter. This section will be great for a higher level overview of how certain event parameters or user properties changed over time for the same event.
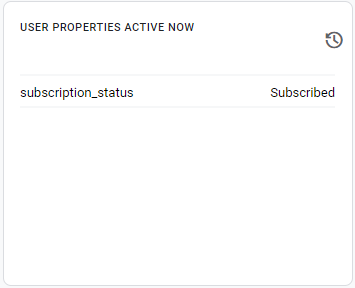
User properties section
Under top events you will see a summary of all active user properties (user scoped custom dimensions).
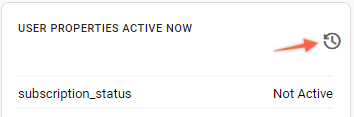
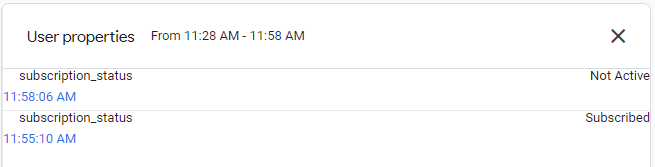
If you click on the clock icon GA will show you how this user property changed over time and when that happened (Last 30 minutes).
Summary
In the previous version of GA not all of the data was available in the realtime reports and you had to either wait some time before it become available or trust that all data passed in the request will reach it’s destination.
With the new DebugView Google Analytics 4 has significantly improved ability and speed of debugging events before publishing Live. Also more granular view on default and custom dimensions (parameters) gives more visibility and understanding of your tracking setup behind the scenes.
