
A guide to GTM Preview and debug mode
It’s always a good idea to test your implementation before publishing any changes Live. With GTM Preview and debug mode, you can efficiently uncover errors and unexpected behavior in your setup before it is available for your visitors.
In this post, we will take a look at what you can do with preview mode to ensure expected tag behavior.
How to enable Preview mode in GTM
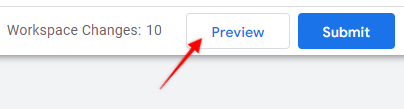
When you are ready to test your implementation just click on the “Preview” button in the right top corner.
It will open a new tab asking you to provide the URL that you want to debug.
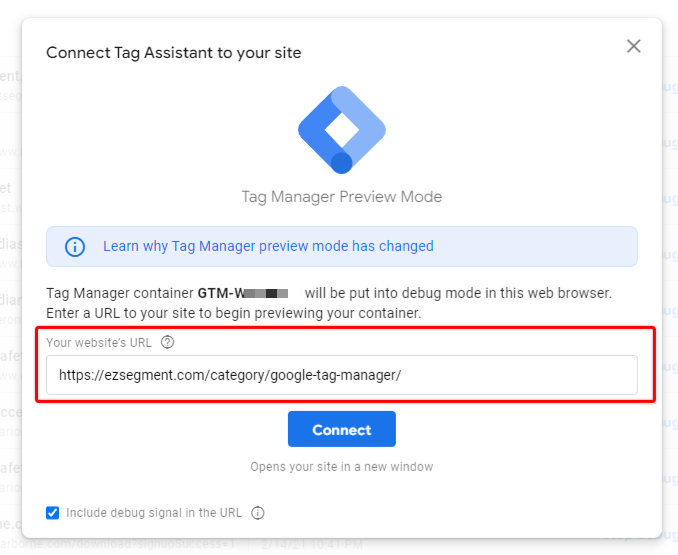
By default, GTM will add a default “debug signal” in the URL E.g. “?gtm_debug=12345689012345”. If your URL doesn’t function properly when in the preview mode try to disable the checkbox “Include debug signal”.

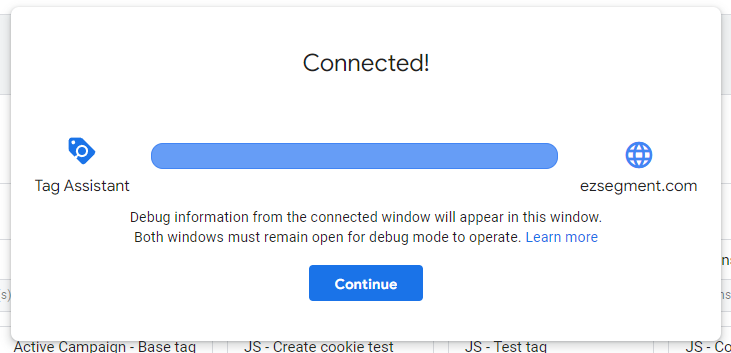
When you click “Connect” your website will open in a new window with preview mode enabled.
I found it more convenient to debug websites in a separate tab instead of a new window. To do that you will need to install the Chrome plugin – Tag Assistant Companion (by Google). It will also allow you to debug iframes and multiple windows from the same preview mode session.
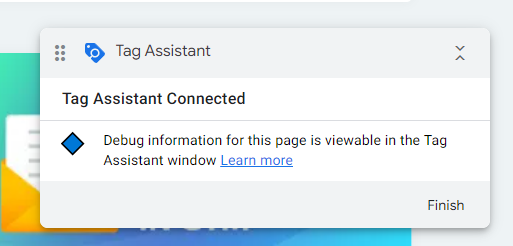
Once preview mode was successfully enabled from GTM, you will see this popup appear on the page that was just loaded.
Note that the provided URL should have installed the same GTM container ID in order to use this functionality. You can’t preview and debug a different GTM container.
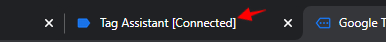
If you open a separate tab “Tag Assitant” you will see a connection success message indicating that you are ready to debug the website.
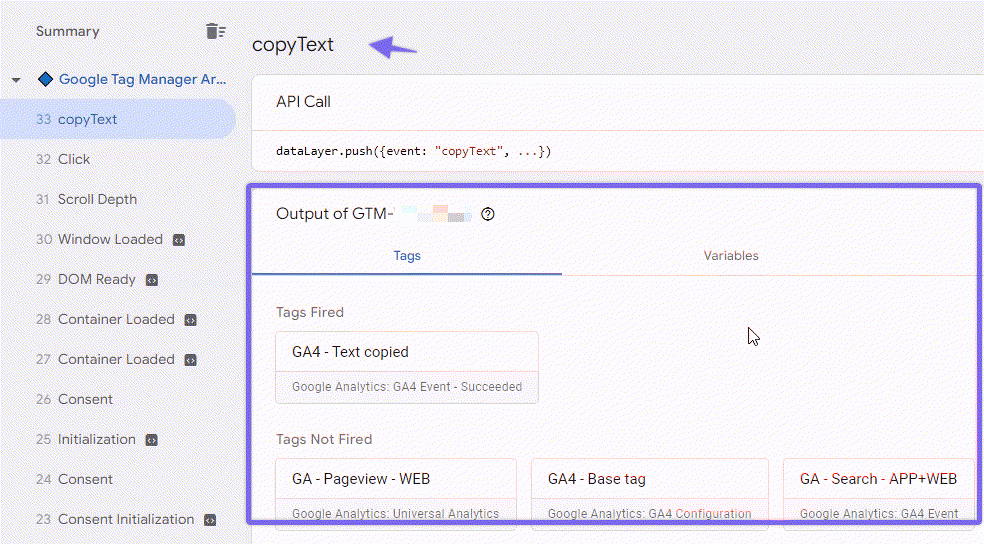
This is the main hub where we can inspect the results of our interactions in the preview window/tab and how each tag reacted to these events.
Tag Assistant components
When we know how to enable preview mode, let’s take a look at available tools for debugging.
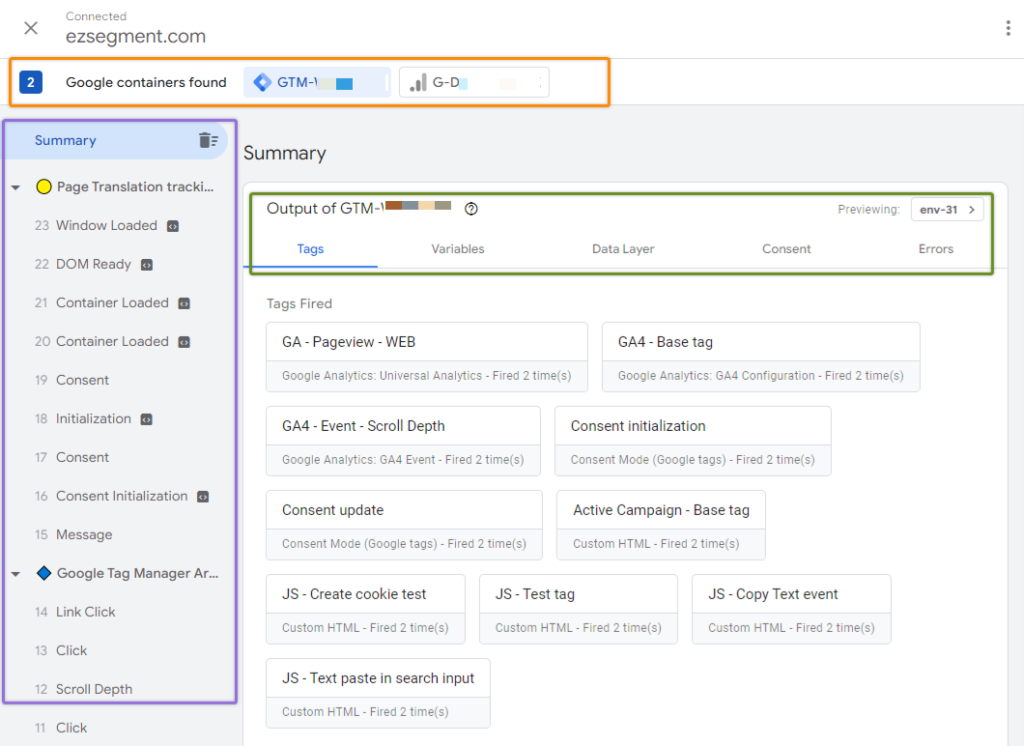
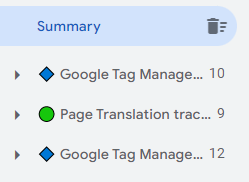
First of all, there are 3 main sections here:
- Container section (orange) – Allows you to switch between Google tags that you want to debug
- Event summary section (purple) – See an overview of received events and their order
- Output section (green) – See which tags were fired, and what are variable contents for a selected event and investigate each tag in more detail.
Container section
On the top of the Tag Assistant window, you will see a list of all unique Google Tags available on a given URL – GTM, Google Analytics, Gtags, etc.
By clicking on tag ID you can switch between the context of sent data. For example, If we select GA4 ID we will see only events related to this particular GA4 property.
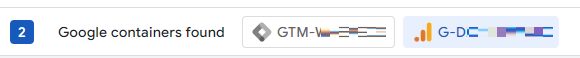
In this post, we will be focusing on debugging GTM events so you need to select the GTM property that you want to debug.
Event Summary section
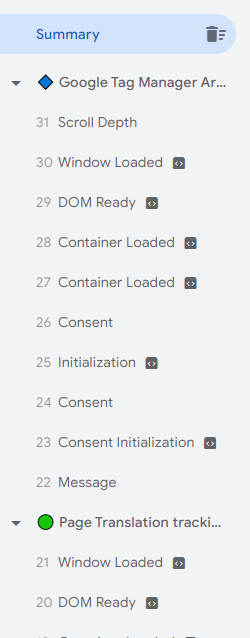
On the left side, you will always see a log of all events that happened on a particular page while exploring the website in GTM preview mode. You can think of it as navigation on the website. When you click on any event name all other sections will be adjusted to show relevant information to the selected event (or current state).
All events are grouped by page views. If you are using the Tag Assistant companion extension your pages will also be marked with a unique icon to differentiate between different windows and tabs within the same browser.
In the example above I have 2 different pages opened in preview mode in parallel so those are differentiated using unique symbols before the page title.
For each page load, you will see at least 5 default events regardless of the GTM setup:
- Consent Initialization – Designed to be used to set and update consent settings
- Initialization – Used for tags that should fire before any other triggers
- Container Loaded – A page view event, fired when the web browser starts to load a page
- DOM Ready – Fired when page HTML structure is loaded
- Window Loaded – Fired when the page was fully loaded, including images, scripts, etc.
Default events are marked with an additional icon. All other events are either triggered by dataLayer or specific actions on the page that are monitored by GTM (E.g. page clicks, scrolls, etc.)
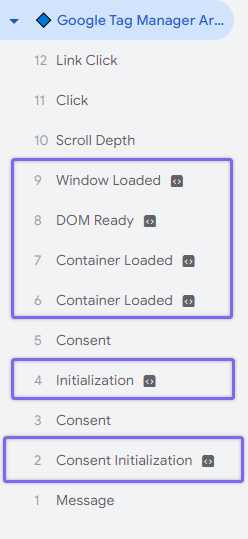
The number before each event name indicates the order in which a particular event was triggered. For example, the “Message” event was the first one sent to GTM before any other events.
What events I should expect to see in the tag assistant summary?
Visible events will depend on the interactions you do on the website and what other dataLayer events were triggered on the page. In other words list of events that you see here will be unique based on your website and GTM container setup.
Here are a couple of examples:
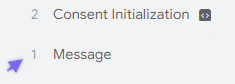
- Message – this event is seen when the data layer object receives data but there is no event name attached to it. If you haven’t worked with dataLayer before, you can check my guide on data layer for beginners.
- Consent – this event appears when Google consent settings were created or updated on the page.
- Click – appears when something is clicked on the website and used by GTM click triggers.
- Link Click – same as above but specifically for links
- Scroll Depth – when a page is scrolled past a specific threshold and used by GTM scroll depth triggers.
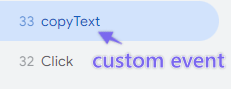
- <Custom data layer Event name> – You could also see custom data layer events coming from website source code or GTM tags that can be used with custom event triggers.
- And there are many more others that could appear here depending on what variables and triggers you have created in the GTM setup (E.g. video engagement, timers, etc.).
Clearing event list in preview mode
When you want to start debugging from a clean slate just click on the trash icon near the summary to clear all event logs. It will delete all events that were collected on the previewed page so far.
Changing context in GTM preview mode by clicking on event names
As mentioned above, an event summary serves as navigation. When you click on any of the events the “outputs” section on the right side will show data that is relevant only to the selected event.
You will see only the tags that were fired by the current event and variable values that were available at the selected state.
You can also take a look at the grouped overview for a particular page or for all pageviews in total. For this click on a page name or on the summary section.
Next, we will take a look at each of the output sections in more detail.
Tags Section
The tags section will show you a summary of GTM tags that were triggered (or not) in the context of the selected event. For example, if you are tracking a scroll depth using a built-in trigger in GTM, you should expect to see working only those tags that are using that trigger.
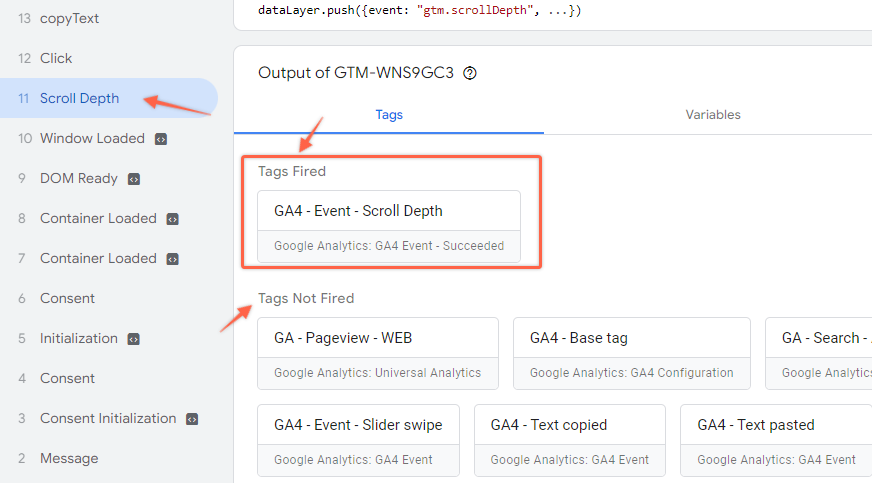
Under “Tags Not Fired” you will also always see a list of tags that were not fired for a particular event.
This section is useful to understand if your tags work as expected under provided conditions.
If a tag is not fired on the expected event you can click on the tag card to see more details.
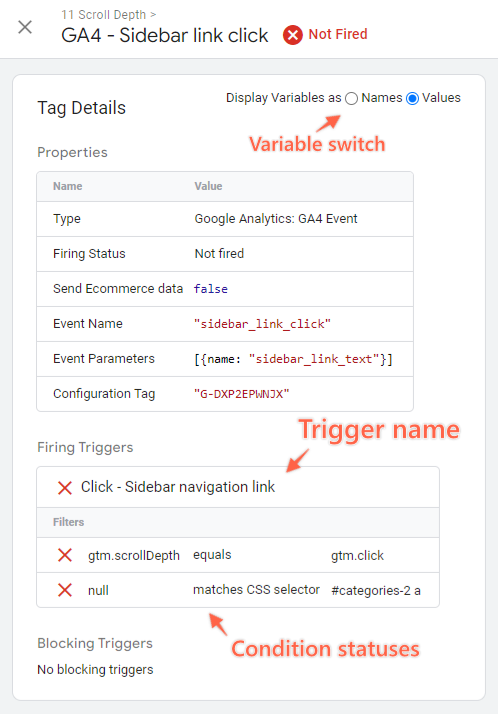
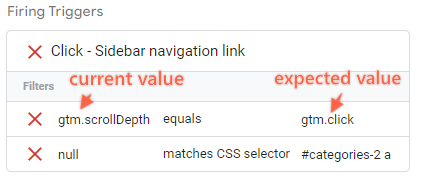
Each tag details card will show an indication if a given trigger (or blocking trigger) was fired and show exact conditions that were not met (see example above).
For each trigger filter, you will see the current condition received by GTM and the expected condition in order to fire a trigger.
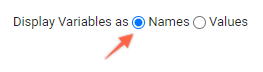
To understand conditions and variable names better you need to switch this setting for more information. It will display either variable names or values.
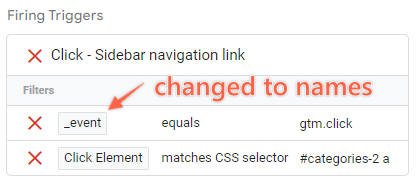
You can use the same approach to investigate what values were passed to your tags.

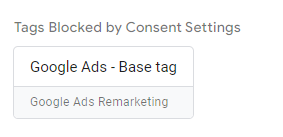
If you have Google Consent enabled in GTM you will also see additional information if there are additional consent conditions that are required. Even if the trigger matched all required conditions tag still may not fire if the required consent settings are not met.
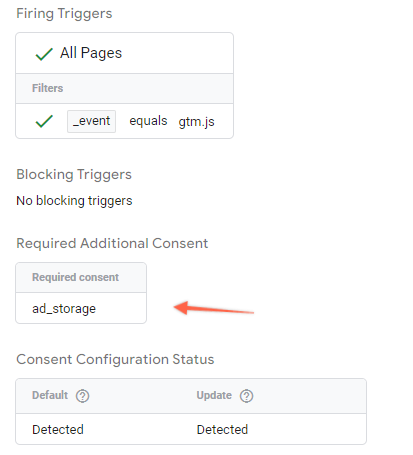
In this case, there will be a separate row called “Tags Blocked by Consent status” that will show all such cases.
Variables tab
The variables tab will show the current state of all GTM variables (custom and built-in) for the selected event. You can use it to investigate the actual values of variables in each state of the GTM lifecycle.
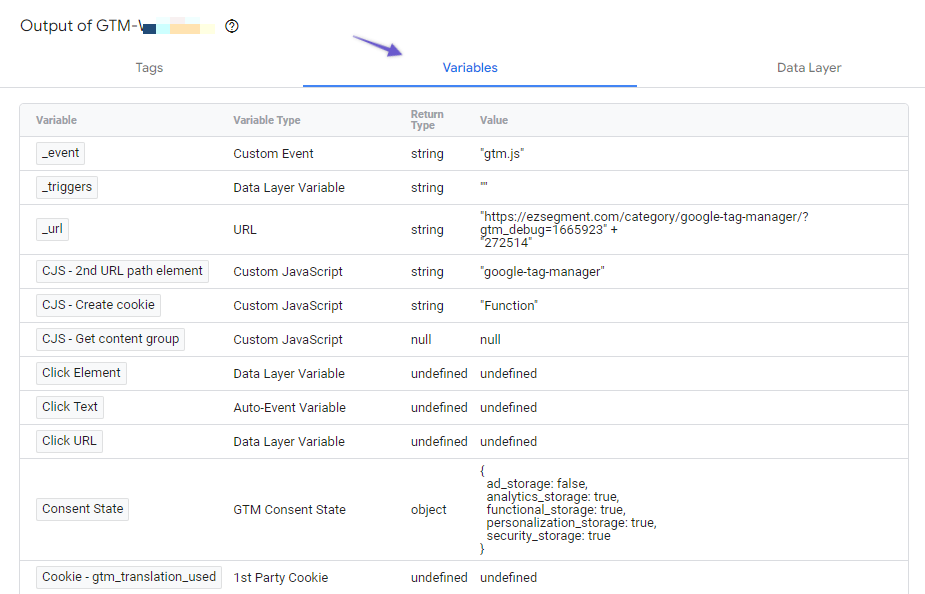
For example, some variables can have a value only when DOM is fully loaded. Using such variables on Page view events would return a value of “undefined”. Same with the data layer events – some variables could not be available for events that happen before data is received.
This tab will allow you to investigate such cases more easily and adjust the tag setup accordingly.
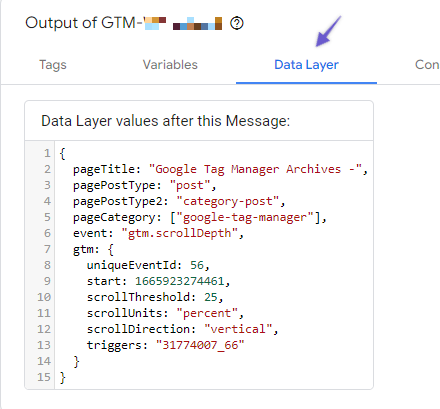
Data Layer tab
Here you can monitor what data is available from dataLayer in the selected event context. Since the Variables section shows only items that were available by default or created in GTM, there you won’t see what else you could use in your setup.
You could also use it to debug data layer contents on the page or on particular actions when those were tagged from the website source code.
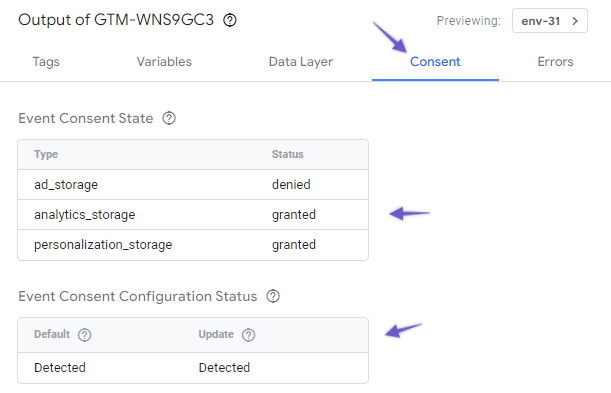
Consent tab
If you have configured Google Consent in GTM then here you will see additional information about the current consent status and a small overview of default consent was set and if it was ever updated.
Errors tab
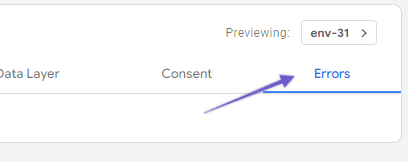
This tab could potentially show errors thrown by a tag or template, but almost always it will be empty. Also if your tags have some JavaScript errors they won’t appear here.
If you see anything here just click on the error message block to read more about the encountered issue. I have almost never used it so at the moment of writing it’s not a crucial part of GTM preview mode.
Version selection
Other tips, tools, and options
Refresh preview mode
If you have updated your setup while preview mode was enabled you will need to refresh it in order to see recent changes. To do this just click again on the “Preview” button inside Google Tag Manager.
Share a preview with a teammate
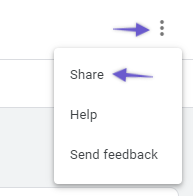
To share the current version preview with another person you need to get a shareable link.
In tag assistant expand the menu at the top right side and click on “Share”.
Choose the tags that you want to allow debugging for (Google tags or specific GTM containers). Provide URL that will be loaded when the GTM preview mode session starts.
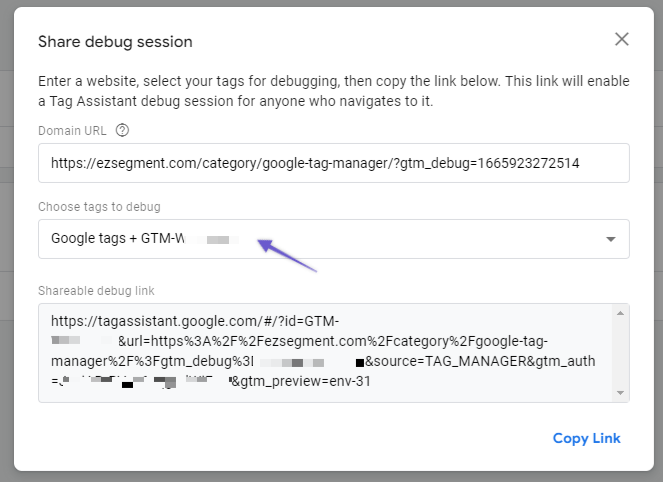
Now you can copy the link and share it. Using this link any person can enable preview mode and debug tags from your GTM container.
Enable GTM preview for the previous version or environment
Sometimes, if tags are not working as expected or you are using the same container in different website environments (staging, dev, etc.) you might need to check previous versions or other environments.
When GTM preview mode is enabled you can easily switch between versions and environments in Tag Assistant.
Find this small button showing the currently previewed environment, above the output section tabs.
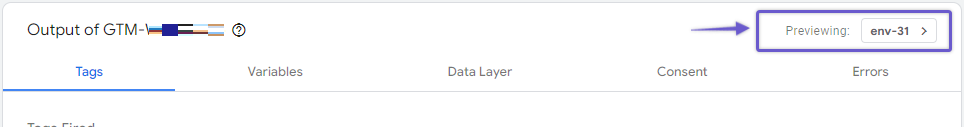
Click on it and you will see all available options for debugging. Click on “Debug” to switch between environment or version.
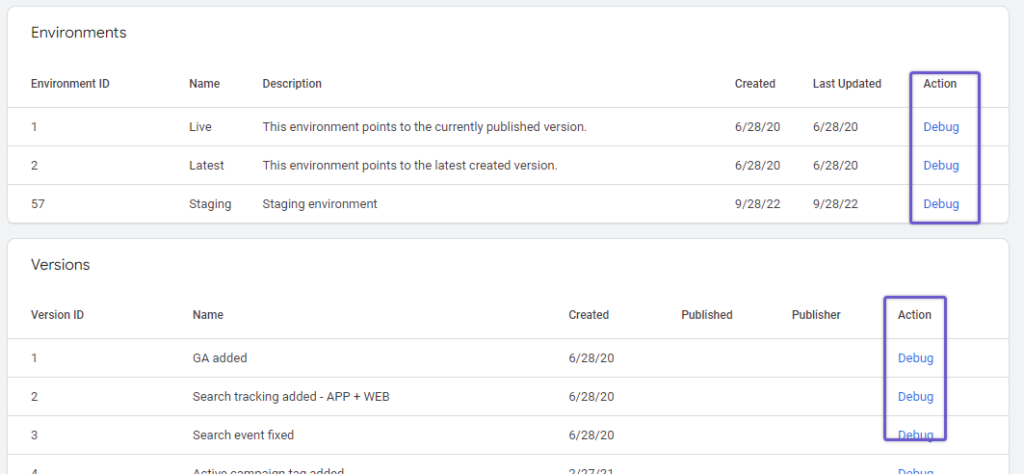
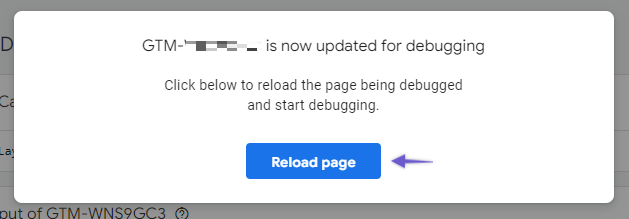
Once the page is reloaded you should see another container/version setup.
Enable preview mode for multiple domains at the same time
If your website flow uses multiple domains or/and iframes (where the same GTM container is installed) then you can enable debugging for both of them at the same time.
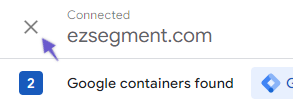
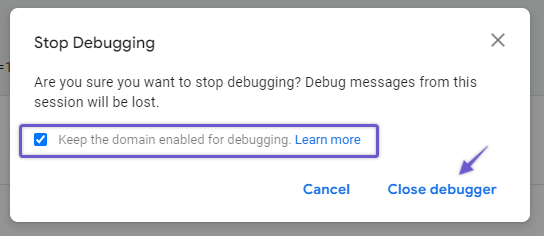
To do this, click on the “close” icon for the current Tag Assistant session.
In the popup select “Keep the domain enabled for debugging” and Close the debugger.
You will see a list of all active domains enabled for debugging and to add a new one click on “Add domain”.
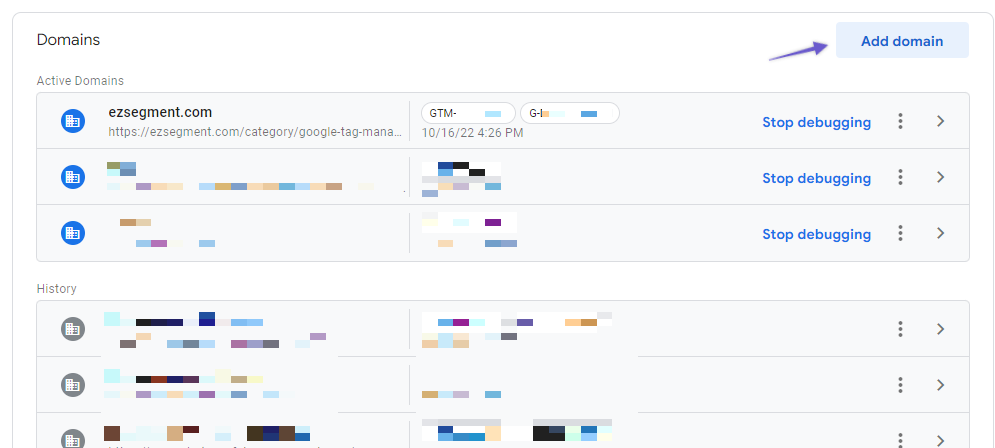
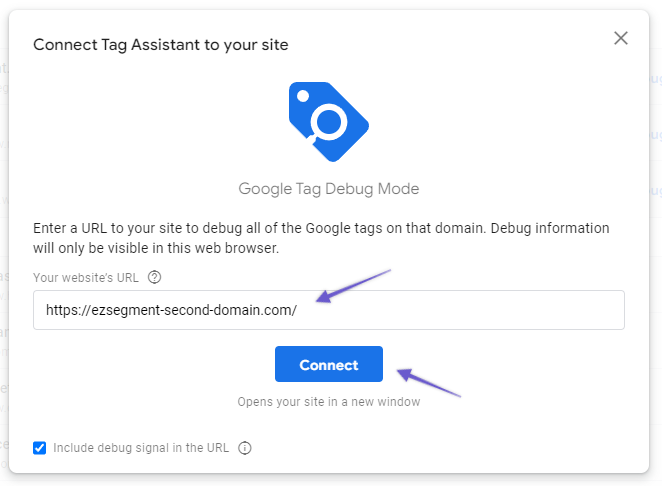
Provide a second domain that has the same GTM container and Connect Tag Assistant to enable preview mode.
Summary
As you can see GTM Preview and debug mode can give you plenty of information. You can find which triggers didn’t fire your tag and why. You can see which variable data was passed and when it is available. And you can have a high-level overview of your events and interactions captured by GTM on the same page.
I hope you found it useful and let me know if you have any questions!
