
Using GA4 real-time data from BigQuery (Streaming export)
If you have set up data export from GA4 to BigQuery you probably know that there is an option to use “Streaming” export to get near real-time data. Initially, I thought it might be overkill to use this feature for regular reports, but after working more with BigQuery I changed my mind.
In this brief post, we will take a look at why you might want to enable streaming export in GA4, how much it will cost you, and how to access this data using SQL.
In case you prefer video format, you can watch it below. You can also subscribe to my YouTube channel!
Do you even need GA4 real-time data in BigQuery?
In short, if you are using BigQuery to output GA4 data in another BI tool and a 1-3 day delay is not something that you are willing to live with – you will have to use “Streaming” export.
Avoid daily export time lag
Every day Google creates a daily export (table) in BigQuery, but there is a time lag of up to 72 hours from the time when events were collected. For example, for the events that were collected on the 1st of January, Google Analytics might export them as late as January 4th. You won’t be able to reliably access yesterday’s events until they are processed by daily export.
When you enable data streaming, you are able to access not only GA4 real-time data but also unprocessed previous-day events that haven’t yet made it into the regular daily export. This will enable you to access collected events for the previous day without waiting for the daily export time lag.
Extended real-time monitoring capabilities
Sometimes it might be necessary to monitor and analyze real-time data that GA4 UI just can’t support so having a streaming export in combination with BigQuery scheduled queries might come in handy.
For example, you might have just launched a new web app version for a segment of customers and you want to keep an eye on vital metrics for each version.
- First, in GA4 you will see only the last 30 minutes and you can’t see dynamics for, let’s say, the last 6 hours. You can easily solve that by connecting your BQ query with any of the BI tools.
- Then if you are interested in other metrics than “Users” and “Conversions”, you can’t view those in real-time from UI. You can customize any metric from real-time data if it is passed in the export.
- And lastly, segmentation capability might not support the type of filters & rules that you want to apply to your data. Again, solvable using SQL.
By using streaming data export, which updates events within seconds of their arrival, and adding a regular update interval for your SQL query you can imitate Google’s real-time reports and analyze it in ways that would be more meaningful for your project.
How much Streaming export will cost you?
Yes, if you didn’t know this already – “Streaming” data export is not free of charge and the costs will be directly tied to the number of events that are being collected. But fear not, luckily, it’s very affordable and at the moment of writing Google will charge you only 0.05 USD per 1GB ( see BigQuery pricing ) of processed data.
1 GB of data is around 600K events as per Google, however, that will very much depend on how much data is passed with each event. In practicality, you could even fit up to 1M events in 1GB if not a lot of data is passed along (Google uses 1KB as the minimum row size for any event).
Example: If your GA4 property receives 200K events per day on average, and the total weight of those doesn’t exceed 200MB then plan to spend 0.01 USD daily on streaming export. This doesn’t include any query costs which will vary greatly depending on the use case.
How to access data from BigQuery
1. Check if streaming export has been enabled
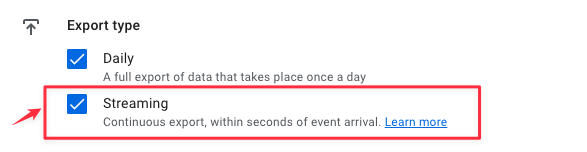
First of all, make sure you have enabled “Streaming” export from Google Analytics settings. You should see this checkbox ticked on your “BigQuery Linking” page.
If you haven’t enabled this yet, please check how to link BigQuery with Google Analytics.
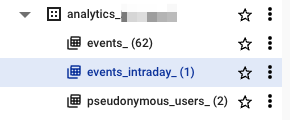
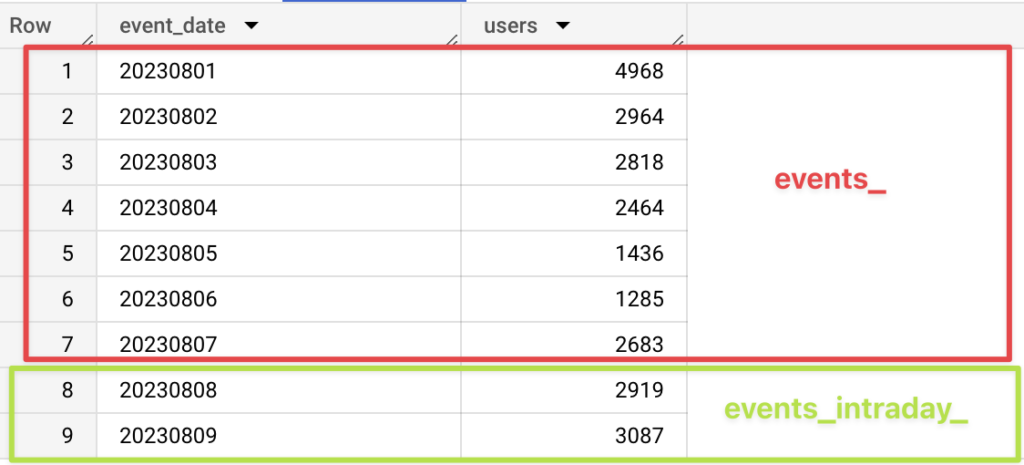
Then, in your BigQuery you should be able to see an additional table named events_intraday_YYYYMMDD . All real-time data is stored in this table and is continuously updated for the current date as new events arrive. Note that it can also contain previous day events if they haven’t made it yet to the events_YYYYMMDD table. Once that date is processed by the daily export this information is deleted from events_intraday_ so both tables will be complementary.
2. SQL examples
To access regular daily export you might have used something like this before:
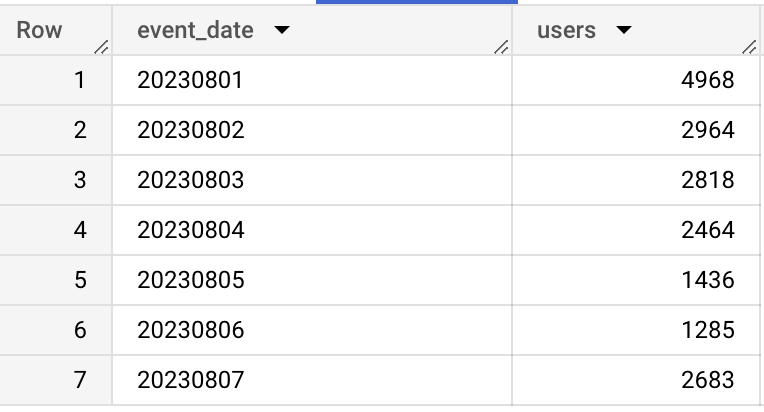
This query would output the number of users per day from the daily export table that begins with “events_“. It wouldn’t contain any data from most recent dates if those were not processed yet, so your output would look similar to this:
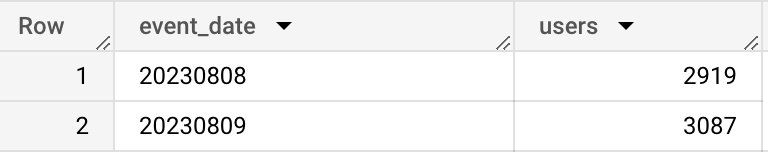
To access Only real-time data we could use the same code, changing only the table name to events_intraday_ , since all the column names are exactly the same as in daily exports:
This would show you only missing dates from the same date range, and in this example, it would be 2 dates.
Finally, combine both daily & intraday results you can simply use UNION ALL on both of the tables and select either all columns or specific ones to save some query quotas.
We are just combining both of the tables with all possible columns ( select * ) and then calculating the number of users from the output. This will give us the full date range as expected:
If you plan to re-use both daily and real-time data in multiple sub-queries you might want to wrap this in a separate sub-query and reference it later, for example, like this:
We are creating a ga4_data table that we can later reference in future calculations.
Specifically for scheduling queries inside BigQuery, you might need to alter query to:
- Use dynamic date range depending on current date
- Aggregate data per hour or minute, to get more granularity.
For dynamic date ranges you could use CURRENT_DATE() function providing your timezone. To get starting date several days in the past you can just subtract the number of days (e.g. below I’m querying up to 5 days in the past).
_table_suffix between CAST(CURRENT_DATE('Europe/Riga') - 5 AS STRING FORMAT 'YYYYMMDD') and CAST(CURRENT_DATE('Europe/Riga') AS STRING FORMAT 'YYYYMMDD')To get number of users (or any other metric) per minute or hour, you can extract that value from event_timestamp column. Here is an example how you could get a dimension that shows date, hour and minute, that can be used for a detailed chart later:
concat(concat(event_date,cast(format("%02d",extract(hour from timestamp_micros(event_timestamp) at time zone 'Europe/Riga')) as string)),format("%02d",extract(minute from timestamp_micros(event_timestamp) at time zone 'Europe/Riga'))) as date_hour_and_minuteThe full query combining both of these examples would look similar to the one shown below.
You can then add a scheduling inside BigQuery or from your BI tool, to have up-to date information for a dynamic date range.
Summary
As you can see from this simple example, it is very easy to have up-to-date information from GA4 BigQuery export using the “Streaming” option. Additionally, streaming export costs would be really low for the vast majority of businesses, so if you’re using BigQuery data for reporting on GA4 metrics there is no reason for you not to opt-in for the “Streaming” exports.
One drawback that you should keep in mind while working with real-time data is that it’s not fully processed yet in the same way as daily export. These tables might not include all possible information such as imported data files and user channel information. Other than that you should be able to use GA4 real-time data in BigQuery for most of the use cases in the same way as regular exports.
Hopefully, this was useful, and let me know in the comments if you have any questions!
