Use Data Extract in Looker Studio to improve loading speed
Let’s take a look at a feature called “Data Extract” in Google Looker Studio that could help you improve the data loading speed, especially in blended data sources when filtering data from UI.
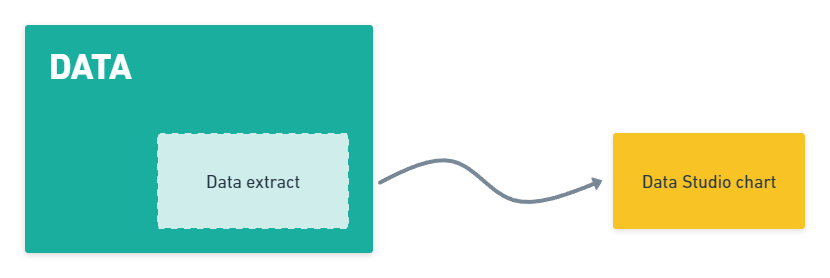
By using data extract you can apply filters and date ranges on a large dataset and update it only once per specified period. This way, when viewing and filtering charts in the dashboard it will be more responsive since we are querying only that part of the information that we are actually using.
Create new data extract
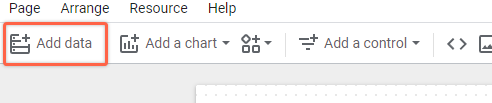
To create a new extract click on “Add data” in the top menu.
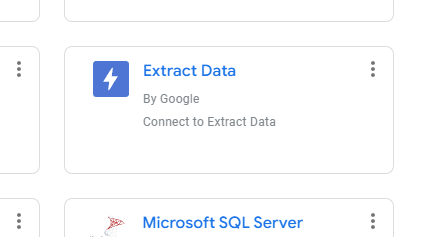
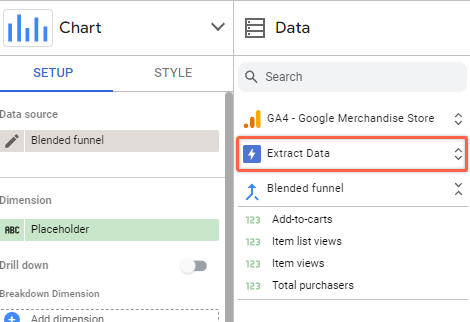
Select “Extract Data” by Google.
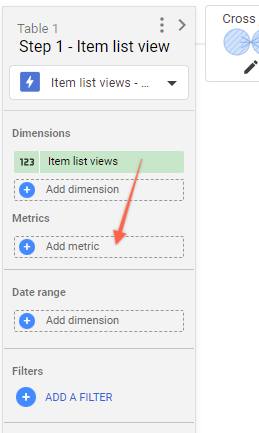
Then you can select the original data source along with all dimensions and metrics that you want to be included there (only those will be available in your charts).
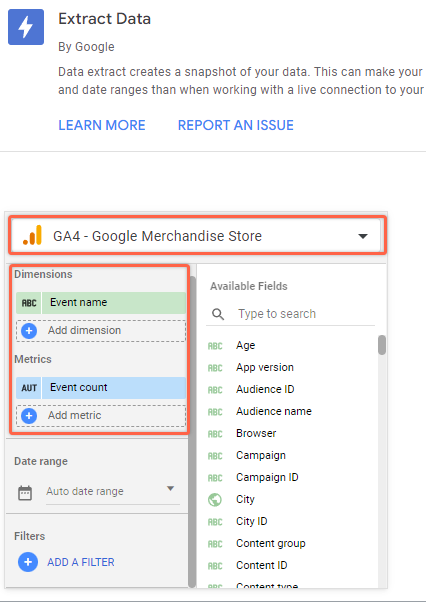
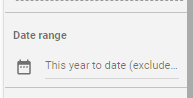
Data extract will pick only the data that falls into the selected date range, so make sure it is enough for your report.
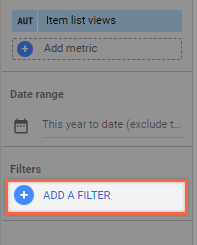
You can further drill down only necessary data by using Filters on dataset metrics and dimensions. So if you are interested only in a specific segment then you could improve the loading speed even further by excluding anything unrelated to the given visualization.
If you are using Data Extract on an already pre-aggregated data set as Google Analytics don’t forget to include Date as a dimension and compare your results with the non-extracted data source, as you might need to do some aggregation manually.
Auto Update
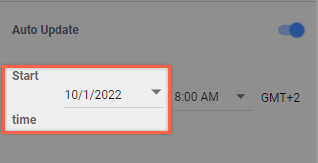
By default, Data Extract will get data once and it will not be updated the same way as in a live connection. To use extracted data source benefits but still have the latest data at least once per day you need to enable Auto Update.
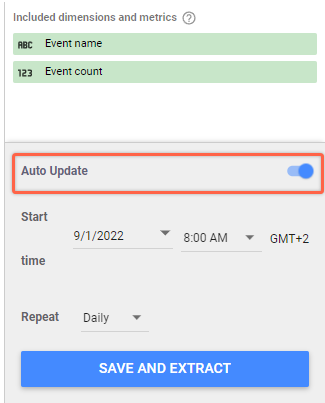
You can find this on the right side of Extracted data source settings, and data can be updated Daily, Weekly, or Monthly.
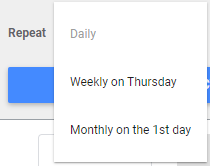
For Weekly or Monthly updates, you can customize the day of the week or date of the month when updates occur by changing the start date. For example, if today is the 15th and you want your updates to occur on the 1st, just pick the 1st day of any month (By default it will offer monthly updates on today’s date).
When you are ready, click “Save and Extract”.
Replace existing data source with extracted data
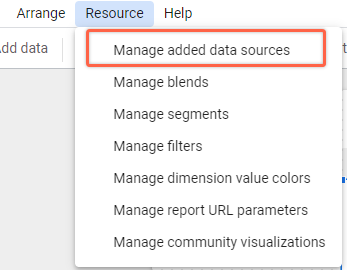
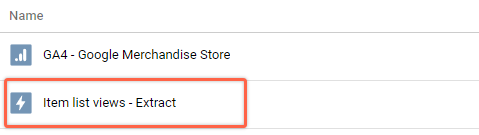
Once you create a data extract you can find it on the right side in the “Data” column or in the top menu – Resource > Manage Added data sources.
If you don’t see your new data extract right after creating, try refreshing the page, since data studio might not show it right away (I suppose it’s a bug).
Select the chart where you want to use the extracted data source and from the Setup menu change the source.
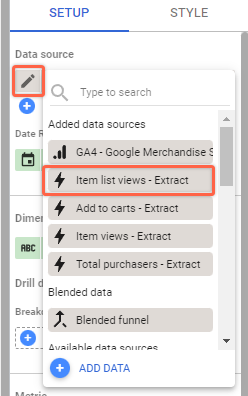
If everything went well, you should see your data displayed from Extracted source now.
Loading speed impact
Here is a small demonstration by using just a date range filter.
As you can see already the data extract data source (on the left) is loading slightly faster than the live data source. You will notice very dramatic improvements for large data tables (e.g. google sheets) or when using more in-depth filtering. In those cases, data extract is one of the easiest ways how to make such reports more usable.
Next steps
How to rename my extracted data source?
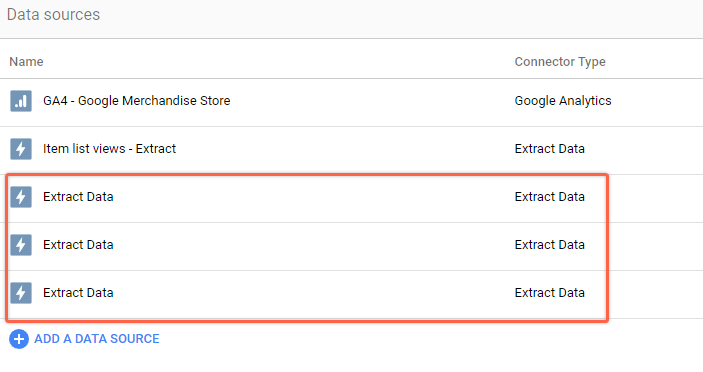
When creating an extracted data source you can’t specify a name at the moment (unfortunately), so if you are creating multiple data extracts in one dashboard it might be hard to understand what’s included in each of them.
- To fix this, you can go to the main menu Resources > Manage added data sources.
- Click on “Edit” for your extracted data source
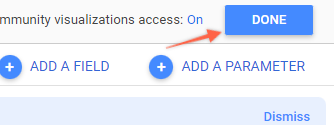
- Change the name by clicking on “Extract Data” at the top.
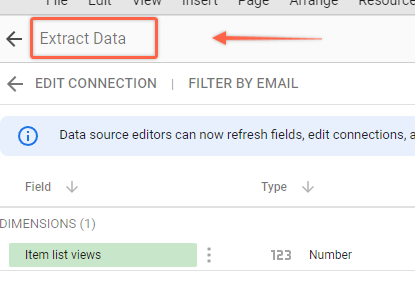
- Click on the “Done” button to save the name
If you don’t see the updated name in the list right away you might need to refresh the page or re-open the data sources list.
How to use data extracts in data blending?
- Make sure to use the same date range and update intervals for each extract
- Dimensions and metrics should match with original live sources from the blend setup
Once you have all data extracts prepared you can apply them to the data blend. Things might go wrong due to missing fields or data, so I would recommend copying original Blended source and later use that to compare the data.
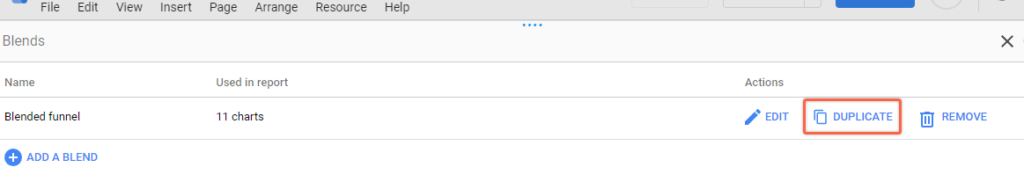
- Go to main menu Resource > Manage Blends.
- Duplicate your blended source
- Replace original data sources with extracted data
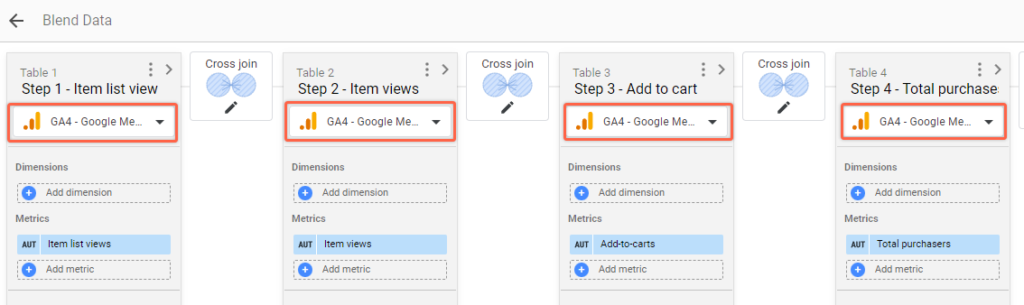
- Make sure your metrics are selected and placed in the appropriate section. Sometimes they may be automatically added to the dimension list.
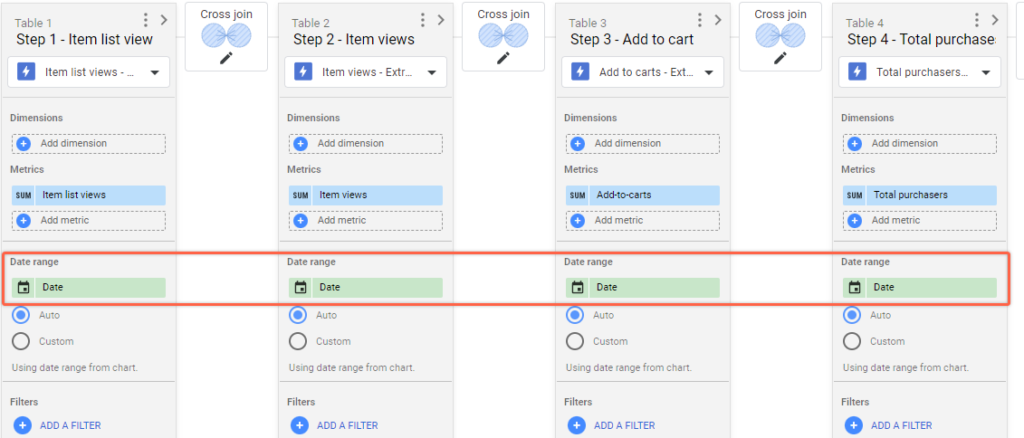
- Don’t forget to provide the date range dimension for each extracted data source, otherwise, it will aggregate all available data in your metrics.
Now you can replace the blended source with the new one and compare the results.
