Track dashboard usage in Looker Studio
When maintaining more than one Looker Studio dashboard it might be useful to know which dashboards are visited the most and what pages are viewed (if viewed at all). Luckily, in Looker Studio you can collect such statistics very easily using Google Analytics.
Create GA property for Dashboard usage statistics
I recommend tracking dashboard views in a separate property so that it doesn’t get mixed with other website/app data. For our purpose, it will be enough to have a GA4 property with a web data stream.
You can create one in Admin section, and clicking on “Create Property”.
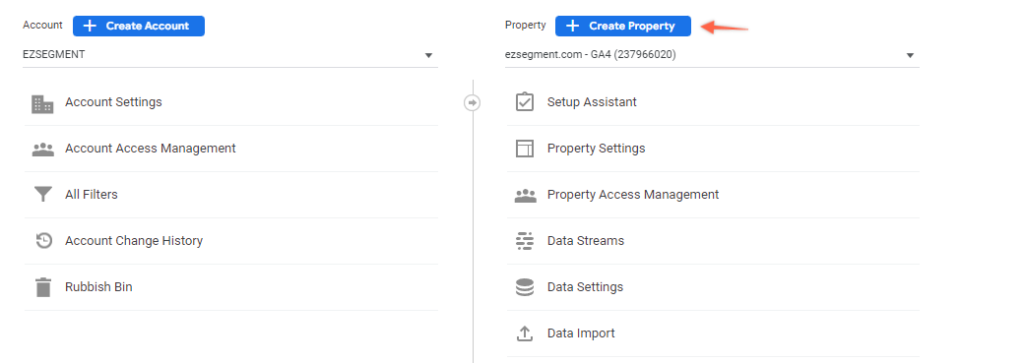
And then just add a new WEB data stream under Data Streams section.
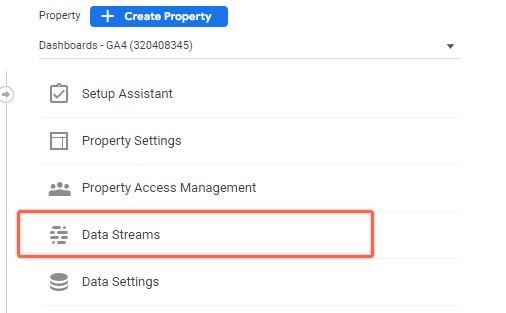
It doesn’t matter what website you specify in the settings in this case, so in my case, I just entered ezsegment.com.
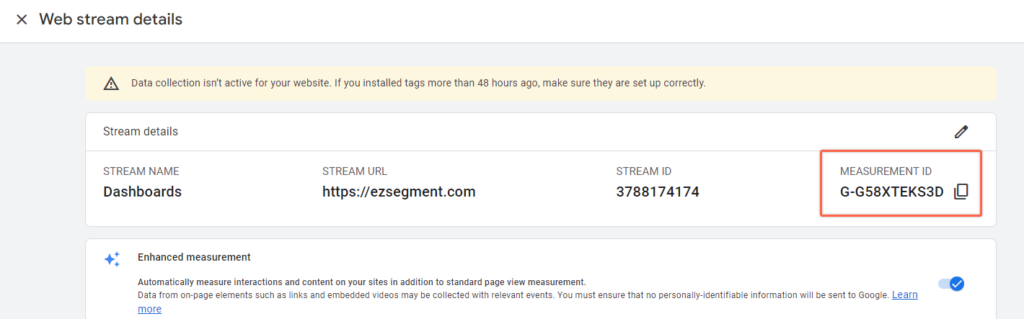
Once the data stream is created you should see your Measurement ID that we will use to collect all dashboard views.
Add Google Analytics tracking into Data Studio
When you have your new measurement ID – Open your dashboard and edit it.
Then open File > Report settings section.
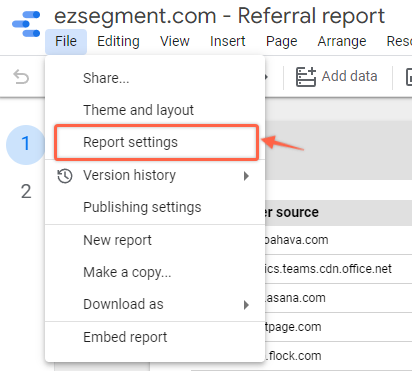
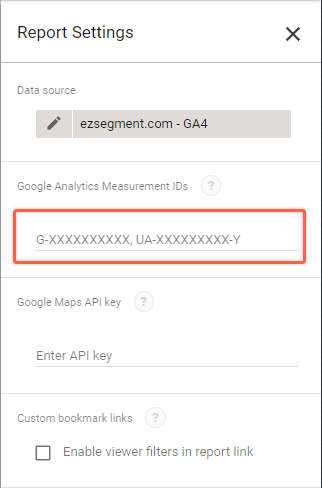
You will see a menu with additional settings, and we are interested in “GA Measurement IDs” section.
As you might have guessed, all we need to do now is to copy our measurement ID in this field and GA should already start tracking your dashboard views.
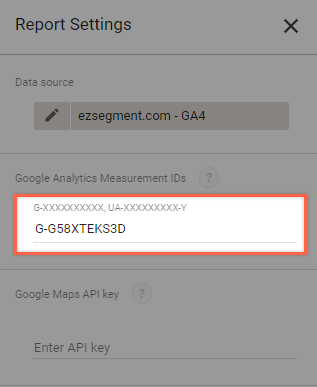
You should do that for every Data Studio report that you want to track in Google Analytics.
Find Dashboard view statistics in Google Analytics 4
When you add measurement ID refresh your dashboard in the View mode so that first hits are sent to GA.
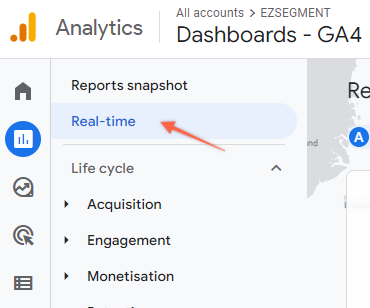
If you were successful you should see your views in the Real-Time reports.
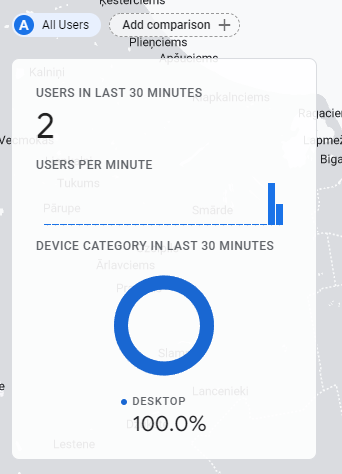
You can also already see each report name and the page that is being viewed, which means this will be available as aggregated historical data too.
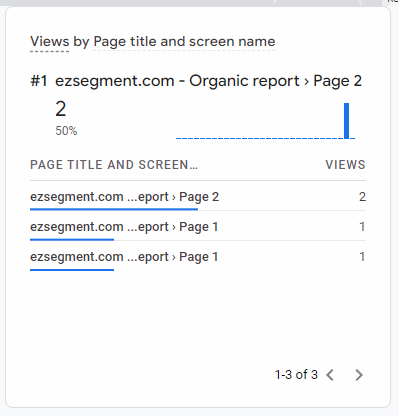
Simple GA4 report with a dashboard performance overview
Since Google is passing page titles and page names from your Looker Studio reports it will be very easy to have an overview in the GA4 property that we created above.
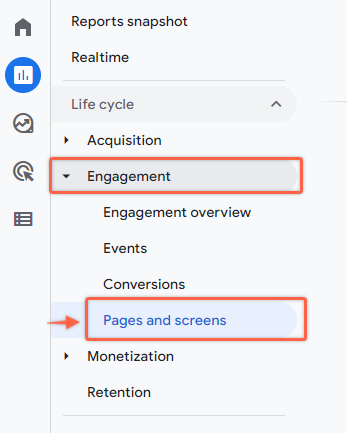
To view historical dashboard performance data (which will appear in aggregated reports the next day after tracking was added) simply go to Engagement > Pages and Screens section. There you will see the name and each viewed page.
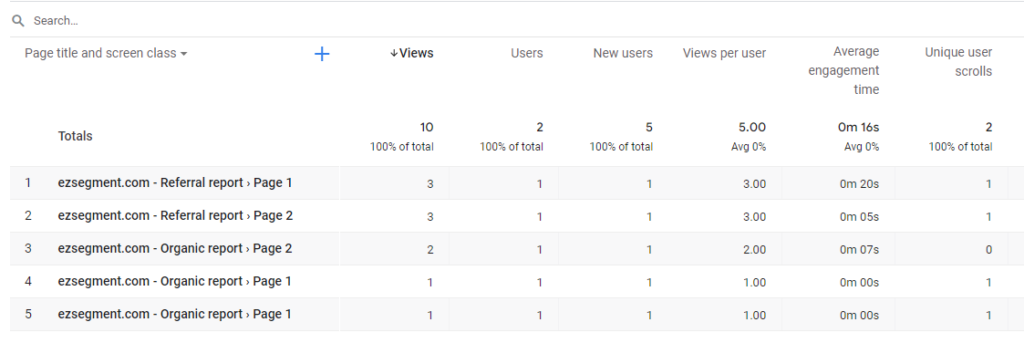
The great thing is that GA4 will also capture some user engagement events as well, so you could see the average engagement time per dashboard section which might be insightful if you are working on improving your dashboards.
