Landing page report in Google Analytics 4 (GA4)
If you have used Google Analytics before the rollout of the new version you might know how to find your TOP landing pages for the site. In Universal Analytics you could just go to Behavior > Site Content > Landing Pages and see where users started their journey on your website.
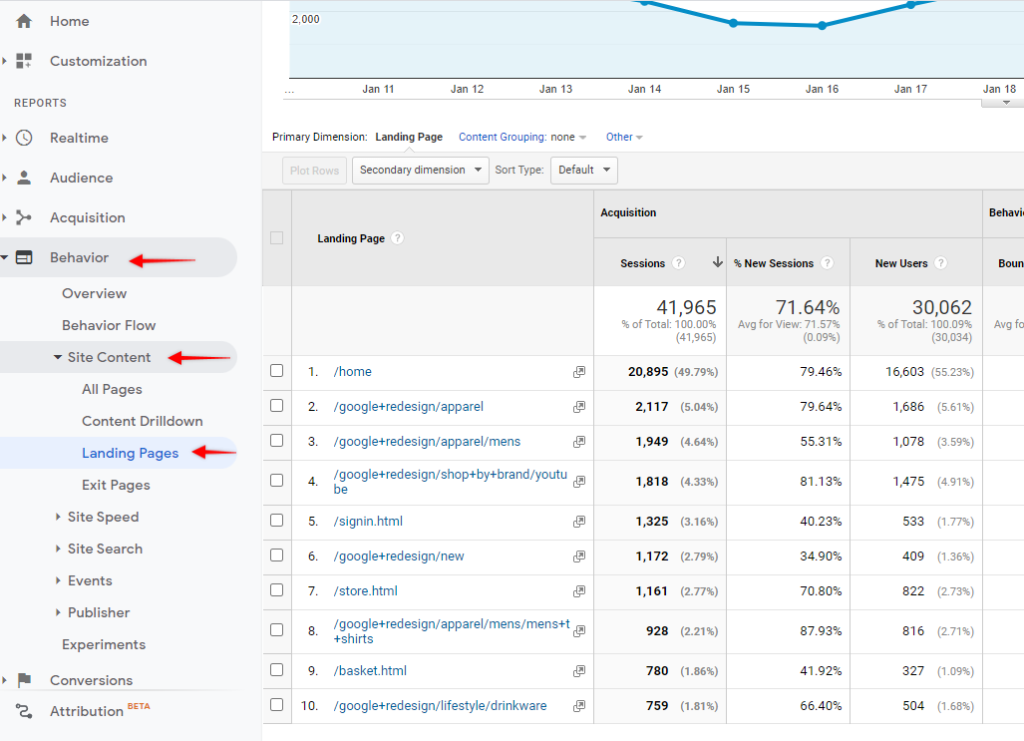
In Google Analytics 4 there is no default landing page report as in the previous version, but luckily we can get this data without too much effort.
Method 1 – Using Pages and screens report to get top landing pages
On the left sidebar navigate to Reports > Engagement > Pages and screens
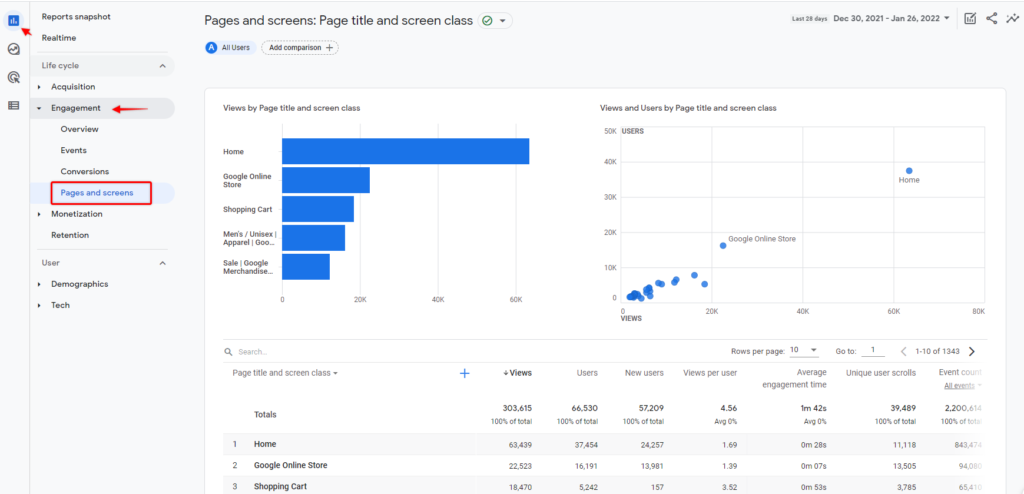
You will see a report with all your page performance and what we are interested in here is table below charts. By default, all pages are ordered by the number of total views and we see only Page titles instead of page paths, so let’s adjust that.
First, let’s pick a different primary dimension to show a list of page paths, by clicking on the “Page title and screen class” dropdown and selecting “Page path + query string and screen class”.
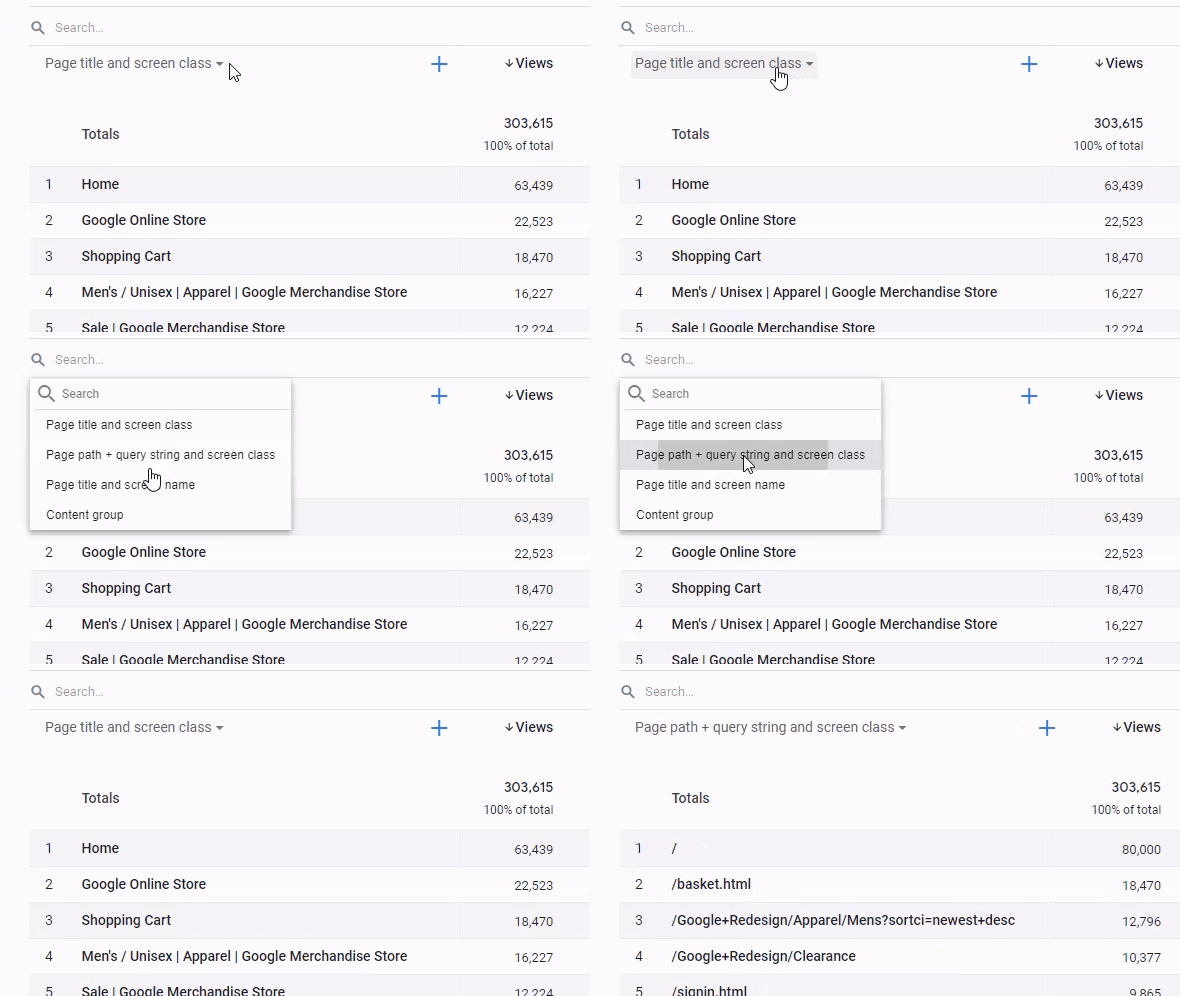
You should see a list of page paths now as in my example below.
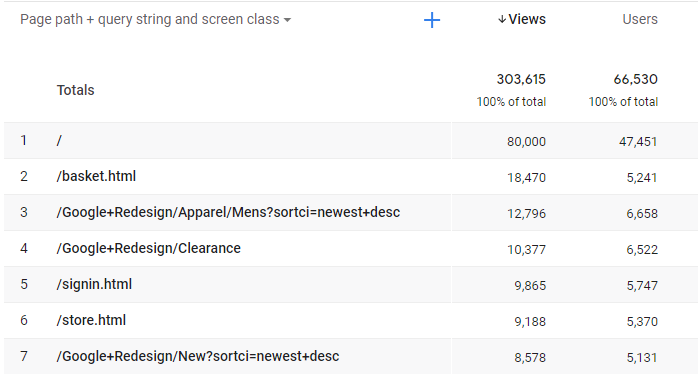
Next, we want to sort them by the number of times users started a session from a particular page (aka a number of landings). On the right side of the table find a column named “Event count” (you can scroll table contents to the right if you don’t see that column right away) and you should see the “All events” dropdown.
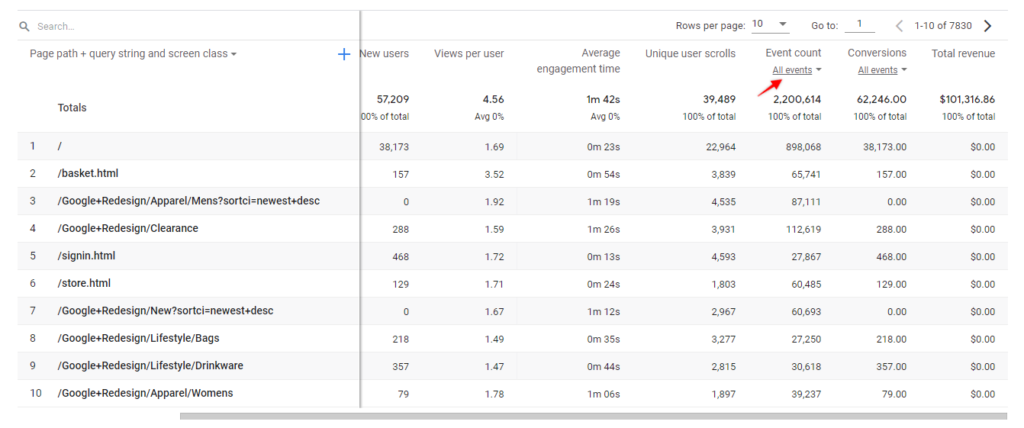
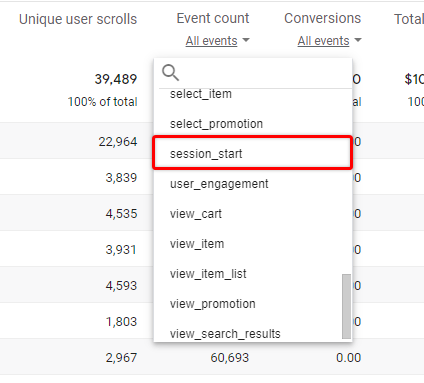
Here, by clicking on the dropdown, we can select a specific event that occurred on a particular page. To get the most popular landing pages, we are interested in “session_start” events, since a page is counted as a landing only if a visitor started a session there.
Select “session_start” from the dropdown
Now let’s sort data by event count to get our top landing page report. You can do that by clicking on the Event count column.
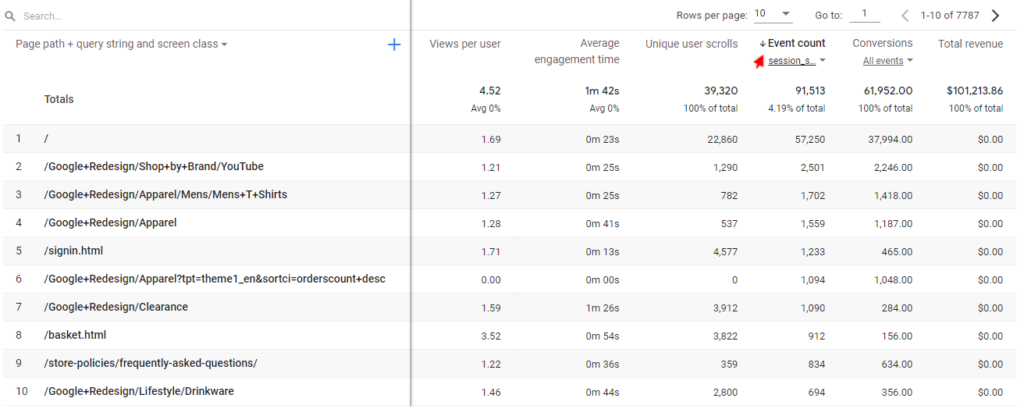
And here it is, our pages are sorted by a number of session start events which essentially shows our top landing pages.
Get more insights from the default report
You can do a deeper analysis in the default report using additional functionality.
Using secondary dimensions
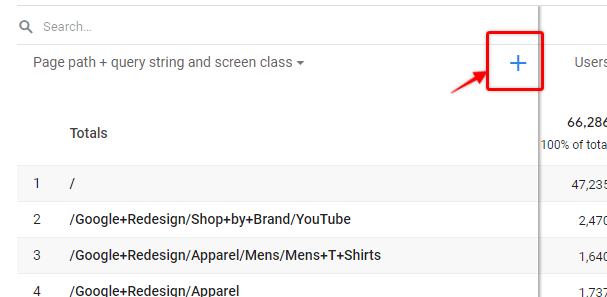
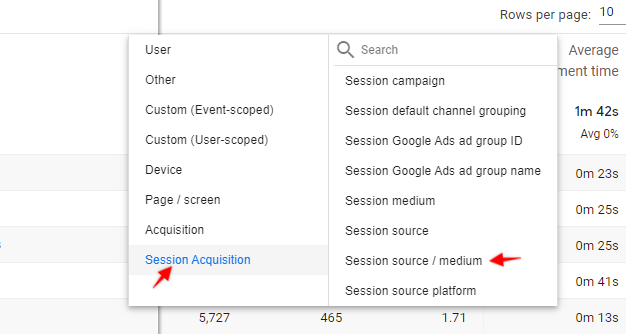
Firstly, you can add a secondary dimension and split your report, for example, per traffic source. You can do that by clicking on a “+” (plus) icon above the page list.
And add, for example, Session source / medium
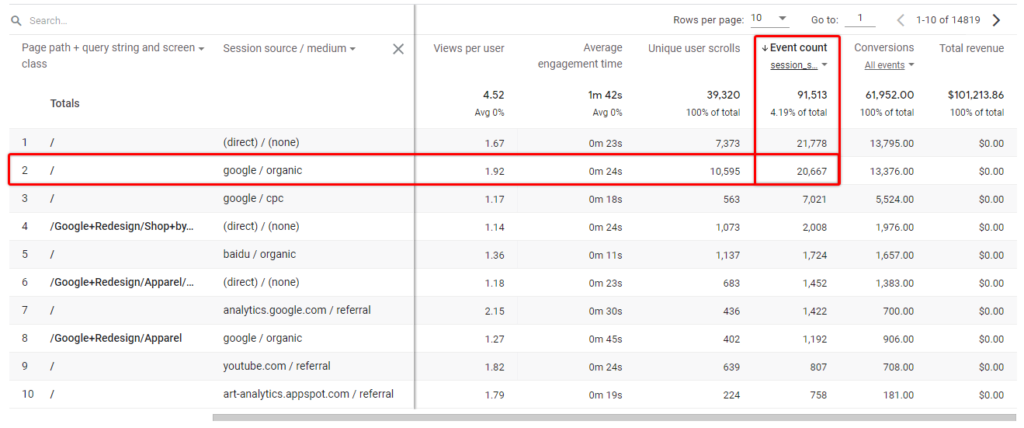
An additional column will appear dividing your data per channel.
For example, you can see that 20 677 sessions started on the homepage from Google organic.
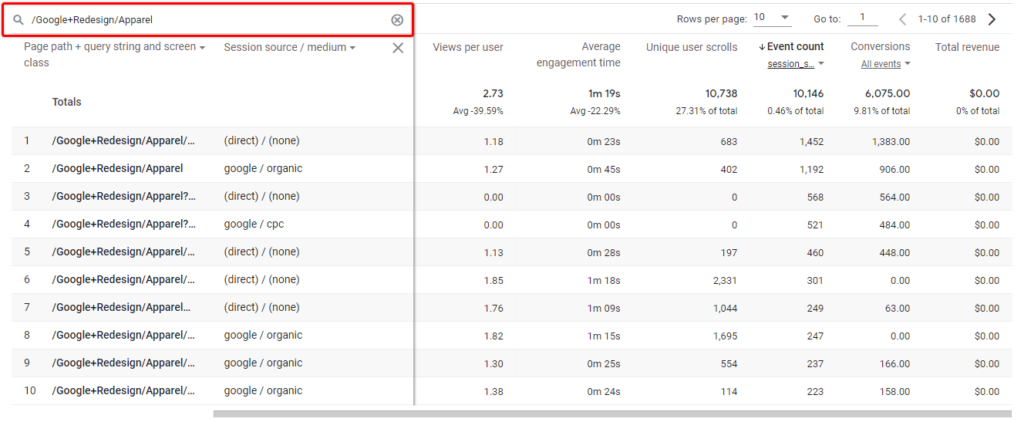
You can drill down this even further by filtering out a specific page in the search box above.
I filtered out /Google+Redesign/Apparel page as an example, so using this approach you could see what channels contribute the most to a particular page visitor count.
There are certain limitations here as well.
Notice how we are seeing multiple source/medium and page path combination duplicates which happen due to unique query parameters that are attached to our page path.
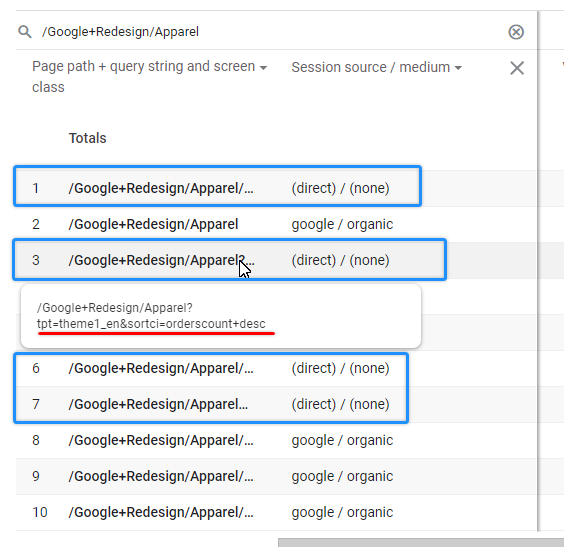
Unfortunately, at the moment there is no possibility to select a different primary dimension in the default report that doesn’t contain any query parameters.
Another thing that you will notice right away (especially after using Universal Analytics) is that you can use a search box ONLY for the primary dimension. So in this case we can filter reports by Page path, but we can’t filter by Source/Medium, for example.
And last, but not least, a search box can only filter using CONTAINS condition. We can’t use regex or EXACT match as we could in Universal Analytics.
For example, if you would like to filter out only the homepage – it would not be possible, since it would match all pages that contain forward slash “/” (that would match all pages).
Luckily, we can bypass some of those limitations in custom reports that we will take a look at in the method 2 section.
Segment usage in default reports
In addition to the secondary dimensions, you can also use simple segments to look at a subset of your landing page report in Google Analytics 4.
To do this, find the segment list on the top of your report and click on “Add comparison”
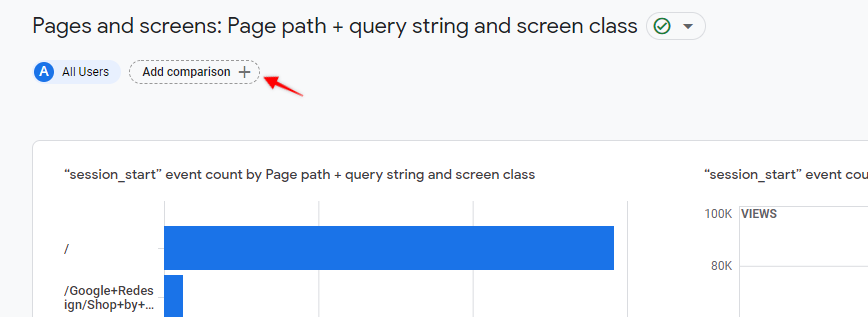
This will show an additional panel on the right side of the screen, where we can build simple segments to filter our data.
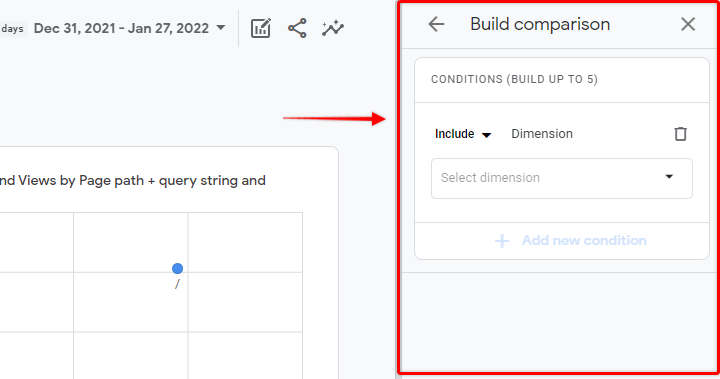
For example, here we can create segments to look at a specific device category or acquisition channel. In my example, I will create a segment to look only at top landing pages from Google organic search results.
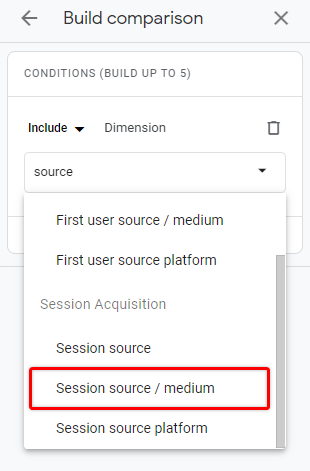
To do this select “Session source/medium” as a dimension. You can also save a bit of time and type a phrase in the search box to find anything faster.
Then I will pick google / organic as a dimension value to filter only Google Organic traffic. You can select any value combinations in your case.
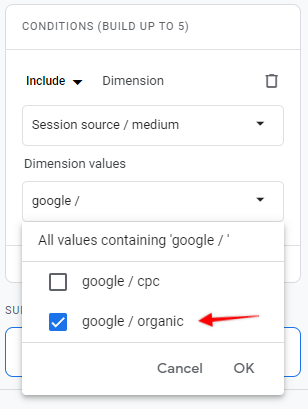
Click “OK” and you should see a similar segment setup:
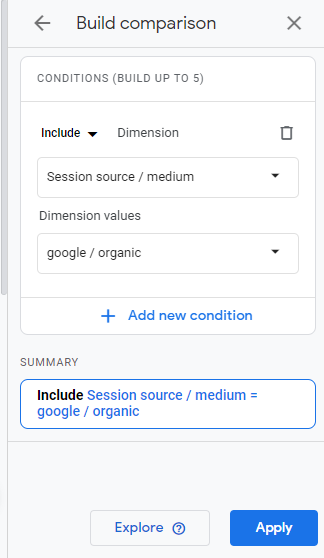
You can add 4 additional conditions for your segment (up to 5). For example, you could filter Only Google Organic landings from mobile devices.
Once you are happy with the setup, click “Apply” and you should now see a similar view:
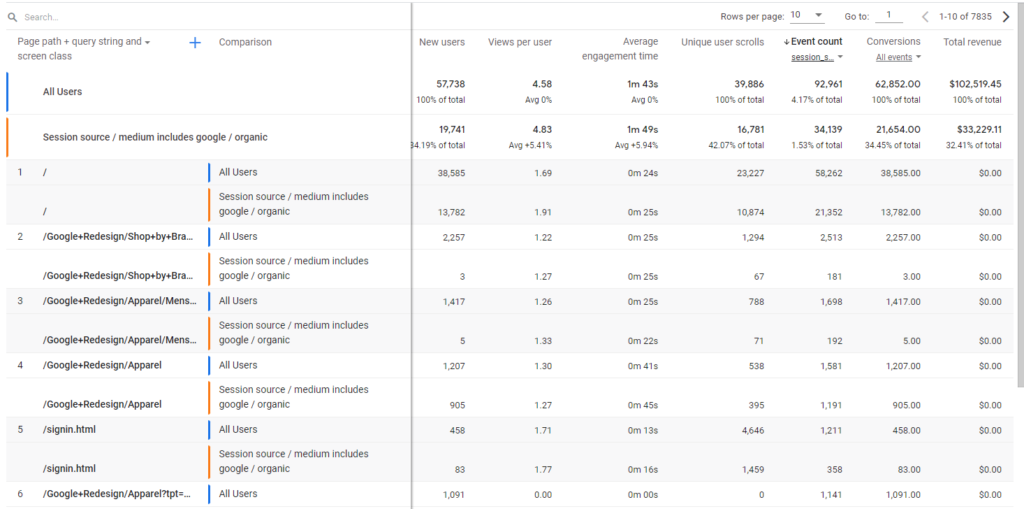
As you can see our report was divided into 2 segments and we can see values for each segment displayed for every page.
To make this report a bit cleaner we can remove the “All Users” segment at look only at Google organic search landing pages (as we initially intended). On the top segment list, click on the cross icon, to remove any unnecessary items.

Now you should see top landing pages only from Google organic search results.
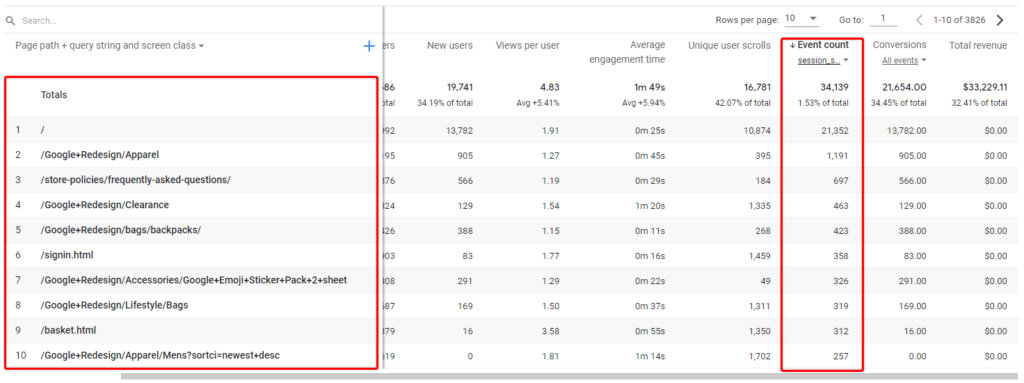
Great! So now when we know how to get this data in default reports, let’s take a look at what we can build in custom reports (aka Explorations).
Method 2 – Custom landing page report
Update from 4th of October 2022 – There is a new metric now in GA4 called – Entrances. This metric shows the number of times the first event in a session appeared on a specified page. So it can be used instead of sessions in the report that is shown below. The original approach with Sessions per page should work too.
In this approach we will create a custom report within the GA4 interface, that will allow us to avoid some of the limitations in default reports.
To start, find the “Explore” section in the left navigation menu.
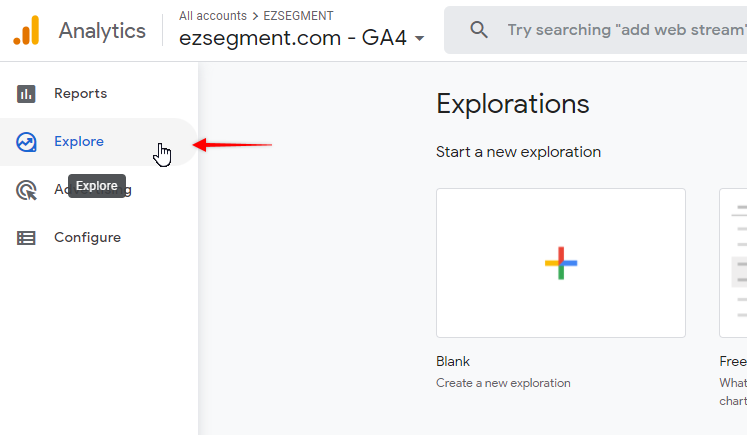
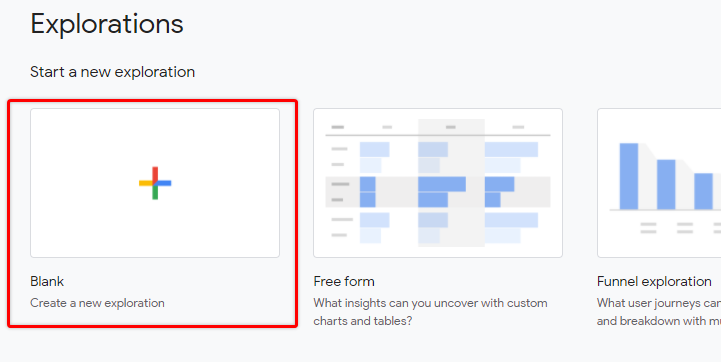
We will create a new Bank report, so pick that from the template.
The essentials that we need for a top landing page report are – Page path and sessions, so let’s add those in the left menu.
Click on “+” (plus) to add new dimension
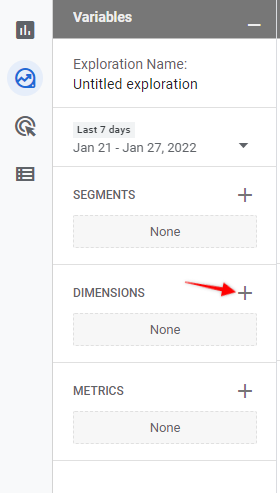
From the list find “Page path + query string” and click “Import”.

Then do the same for Metrics section and select “Sessions”

You should now have the following setup in the left panel:
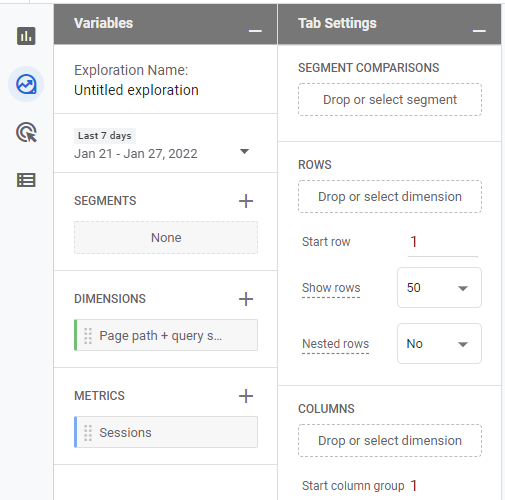
Next, we will add dimensions and metrics to our report. Click on “Rows” field and select our Page path dimension.
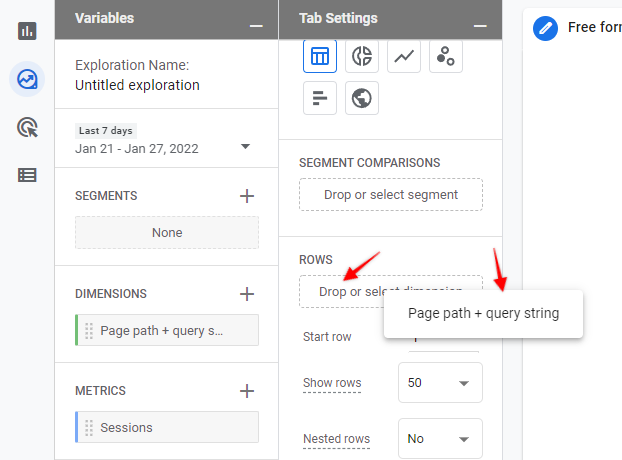
Do the same for the Values section ans select “Sessions”
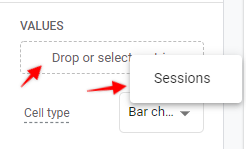
Your report should now update and on the right side of the screen you should see similar view.

Now you can see most popular landing page paths sorted by total sessions.
Why would I want to create a custom report instead of the default one?
Remember the limitations mentioned in method 1? We can solve some of those in custom reports.
- First of all – you can add any kind of secondary dimensions and filter those easily.
I will use the same example and add the Source/Medium dimension and filter only Google organic search.
Add additional dimension – Session source/medium to this table same as we did with page path.
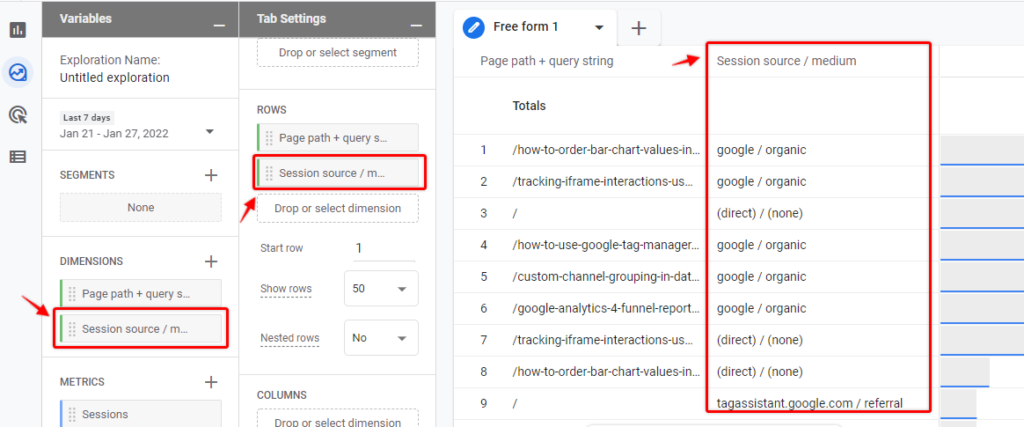
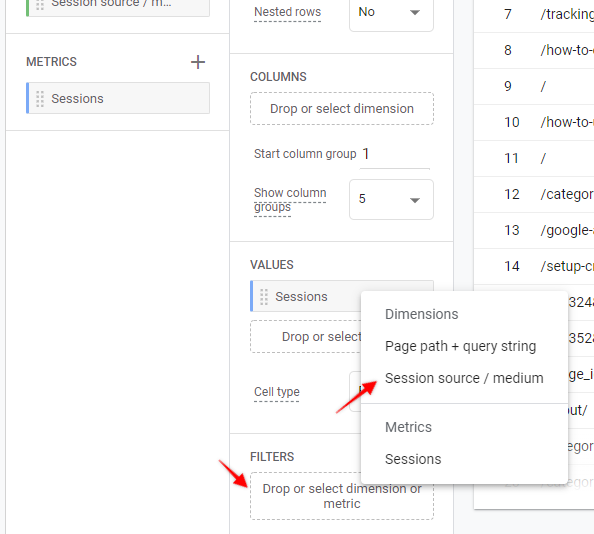
Then in the left pane “Tab Settings” scroll down to the Filters section and click on the box. From there select Source / Medium as our filter.
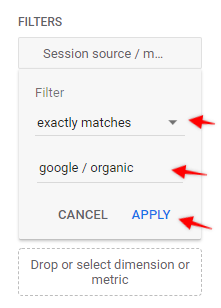
Now select match type – “Exactly matches” and value – “google / organic”. Apply changes.
Now your report will show only the top landing pages from Google organic.

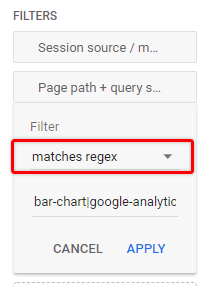
- You can use any match type for your filters
Want to use RegEx to filter multiple pages at the same time? No problem!
Just pick any of the 10 match types available in the filter setup and you are good to go.
Other notes and final thoughts
Shouldn’t I filter this report by “session_start” event to see Landing pages?
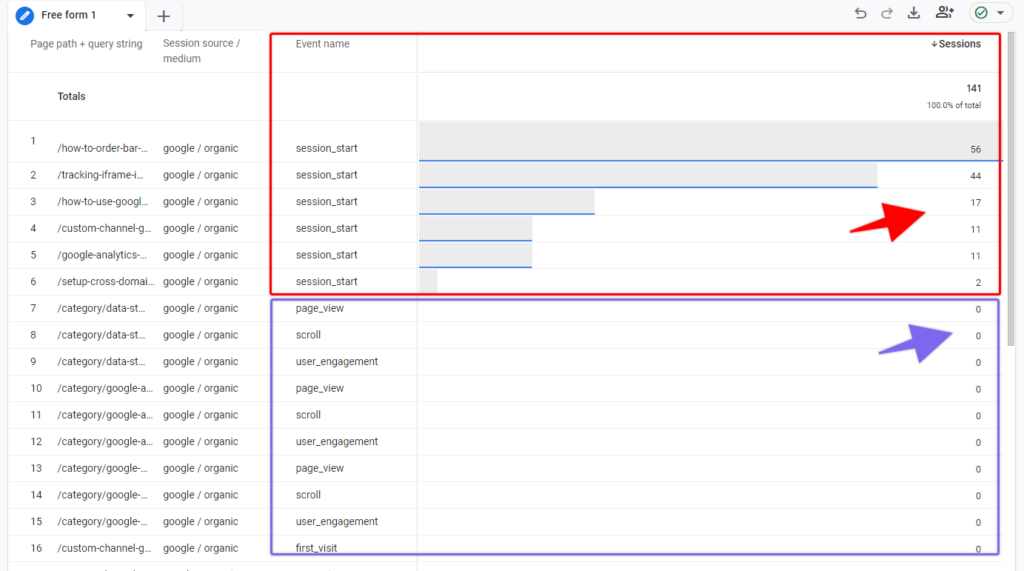
In short – No, the session metric already shows a number of session_start events split by page. If you want to double-check that, you can add the additional dimension “Event name” to the same report. And then see that sessions are only attached to session_start event, other events have 0 sessions.
How can I view only page paths without query parameters?
Unfortunately, you can’t pick any other default dimension for the page path that wouldn’t show query parameters, so I will leave it as additional material for future posts, as this could be solved with Data Studio or a custom parameter inside GA4.
I hope you found this post useful and good luck analyzing your landing pages!

